MRI can give detailed measurements of brain morphometry as used for instance in radiological diagnosis. A clear example of this is shown in fig. 1 which demonstrates the massive loss of brain tissue in four patients with alcohol dependence as compared with an age and sex matched healthy control group (image courtesy Prof David Nutt, Imperial College London). Similar brain shrinkage is shown in dementias such as Alzheimer’s disease as seen in fig. 2.

Figure 1. MRI scans reveal brain damage from alcohol. Source: David Nutt, Imperial College London.
These morphometric measures can be made quantitative through statistical programmes such as VBM [voxel-based morphometry] that can estimate the density of the brain and its subregions. However, DTI imaging can be used to delineate neuronal pathways across the brain [see Part 1] and this is now becoming more quantitative with statistical procedures developing so that different patient populations can be compared. Brain volume measures derived from MRI have been used to understand basic concepts such as the role of the hippocampus in memory. A famous study of London taxi drivers who have to learn a massive amount of road names and route data found they had increased volume in their hippocampi compared with controls who did not drive taxis.1 They have also been used to detect changes in people with mental disorders e.g. military personnel exposed to trauma and with PTSD were found to have larger amygdala volumes than non-exposed controls.2
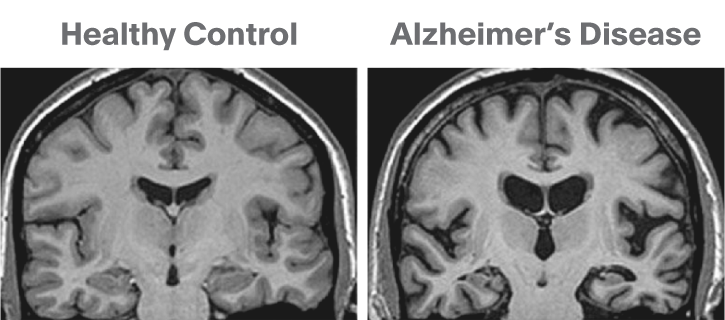
Figure 2. MRI scans reveal brain shrinkage in Alzheimer’s disease patients. Source: David Nutt, Imperial College London.
PET and SPECT(=single photon emission computerized tomography) can measure the distribution and density of proteins to which tracers bind.
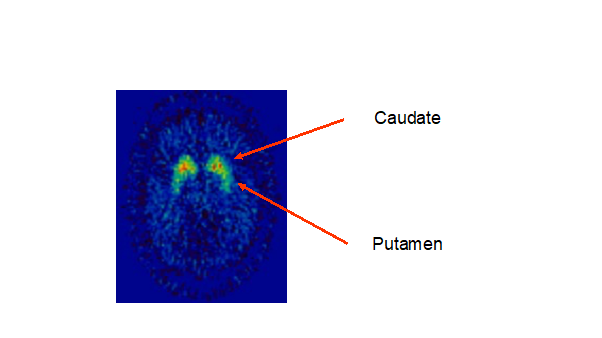
Example of the evaluation of the receptors distribution: Fig. 3 shows a PET scan of dopamine D2 receptors in brain as identified by the binding of 11C-raclopride. The highest density of these dopamine D2 receptors is detected in the striatal regions of caudate and putamen which makes sense as the majority of the dopamine-producing cell bodies (those from substantia nigra) project to these regions3. In contrast the GABA-A receptors have a very different distribution4 as seen in fig. 4 which shows a PET scan of the benzodiazepine receptor tracer 11C-flumazenil. These are largely detected in cortex with relatively little binding seen in striatum and thalamus.

Figure 3. Dopamine receptors in human brain labelled with 11C-raclopride. Source: David Nutt, Imperial College London.
Measuring receptor density with PET and SPECT has proved very useful in defining alterations of neurotransmitter receptors in disease states.
Example of the evaluation of receptor density: Several studies (e.g. Volkow et al 19935) have shown a reduction in number of D2 receptors in patients with cocaine addiction, which is believed to contribute to the inability of those with cocaine abuse to restrain their drug use5. In in fig. 4 we can see reduced benzodiazepine/GABA-A receptors in fronto/temporal brain regions in patients with panic disorder. Similar benzodiazepine/GABA-A receptor deficits are also found, though to a lesser extent in patients with Generalized Anxiety Disorder and Post Traumatic Stress Disorder. Reductions are also found in epileptic foci and so 11C-flumazenil imaging is used in leading neurosurgery centres to locate these prior to surgical removal. It is thought that the reduction in GABA-A receptors leads to reduced GABA-A inhibition which in turn leads to excessive glutamate excitation that ultimately provokes seizures depending on the brain regions affected4.
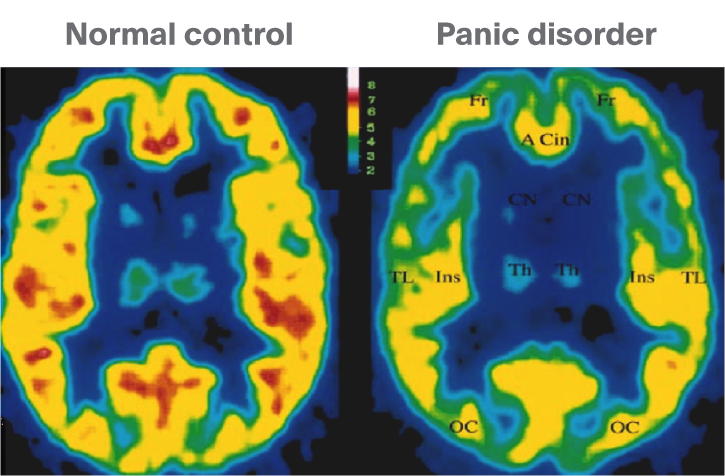
Figure 4.
PET scan measuring GABA-A receptors in normal brain and in people with panic disorder. Source: David Nutt, Imperial College London.
PET tracers now exist to measure a number of neurotransmitter receptors and reuptake sites and a few enzymes. One of the most revealing studies has been those estimating the density of the serotonin 5-HT1A receptor in depression using the 5-HT1A receptor antagonist tracer 11-C WAY1000635.7 These data are shown in fig. 5 using the 3 axis projection system. The voxels that show a significant reduction in density in depressed patients as compared with age- and sex-matched healthy controls are shown in shades of grey with the darker the colour the more significant the reduction. This was the first demonstration of a serotonin abnormality in living human brain in depression and was further extended by the same group revealing that the deficit did not recover on successful treatment. This suggests that the reduced serotonin receptor number may be a trait – rather than a state – marker of depression7. We hypothesize that the effect of SSRIs to lift depression is due to their increasing synaptic 5-HT concentrations to a level that offsets or compensates for the receptor deficiency. Also, first-degree relatives of the depressed subjects had a similar though lesser reductions on receptor number which suggests this possibly has a genetic basis.
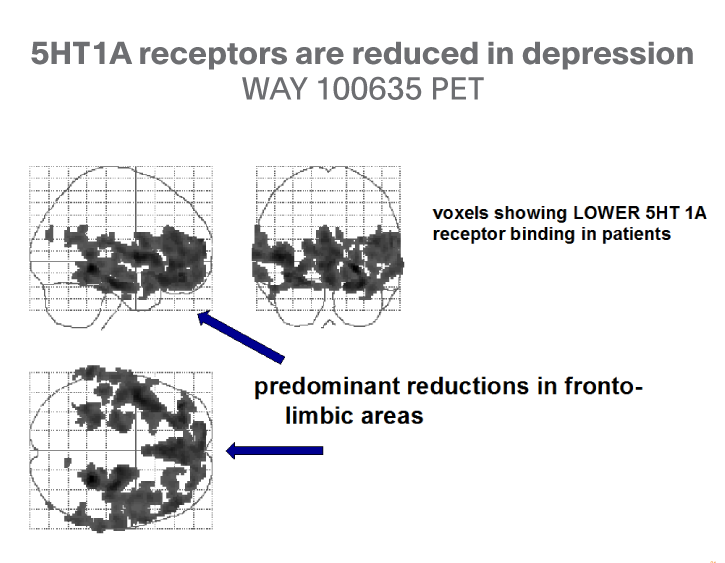
Figure 5.
Density of the serotonin 5-HT1A receptor in depression. Note the field of view was focused on the limbic system and prefrontal/orbitofrontal cortex as shown. Source: David Nutt, Imperial College London.
PET tracers can also be used to measure enzyme distribution and potential activity. The well-studied brain dopamine system is thought to play a central role in drug abuse. We can now measure most of the elements of this neurotransmitter system. 18F-dopa can be used to give an estimate of dopamine synthesis rate, 11C-deprenyl to measure MAO (monoamine oxidase) activity, 11C-raclopride to measure D2 receptors and 11C-bCIT to measure dopamine transporter density.
While the use of neuroimaging has helped us better understand alterations in the brain dopamine system in addiction, it has also proved useful in aiding diagnosis of Parkinson’s disease where 18F-dopa uptake into the striatum is reduced.8 Also the 11C-deprenyl tracer has been used to reveal that cigarette smoking blocks MAO enzymes which may explain the mood elevating effects of smoking.9
The brain mu opioid receptor system can also now be imaged using PET tracers such as 11-C diprenorphine (an antagonist tat binds to all three of the opioid receptor subtypes – see fig. 6) or 11-C carfentanil that is an agonist tracer that binds to the mu receptor subtype.
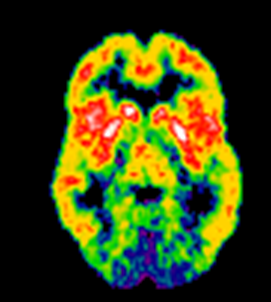
Figure 6. 11-C diprenorphine PET image showing the distribution of opioid receptors in human brain. Source David Nutt Imperial College London.
Measures of the density of proteins can be useful in diagnosis as shown in Alzheimer’s disease where the deposits of b-amyloid can be imaged using a tracer such as 11C-PIB as in the right side of fig. 7. The left side of this figure shows the other imaging technique (18F-FDG PET) which is used in diagnosis by measuring cerebral metabolic rates of glucose. Circles show the brain regions where the largest changes are generally seen.
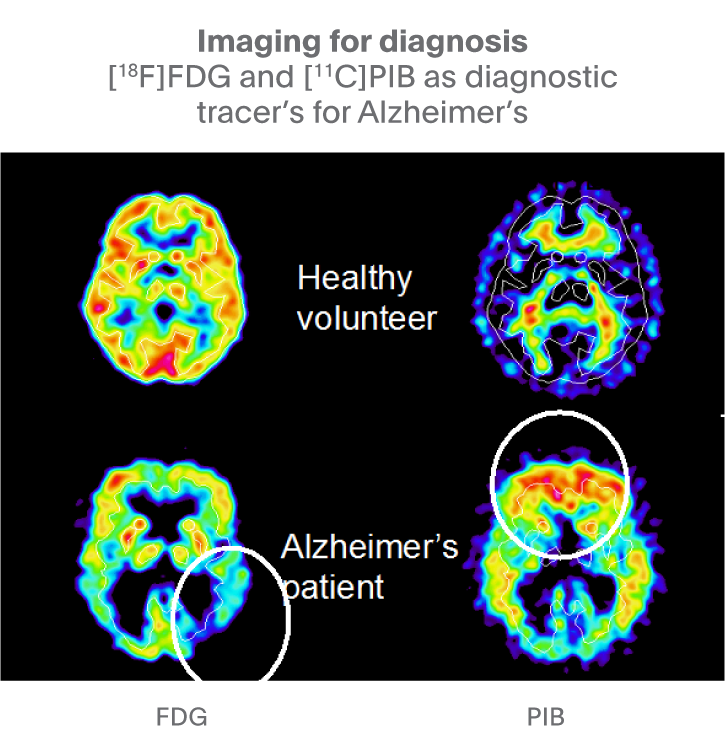
Fig 7. 18F-FDG PET measures cerebral metabolic rates of glucose and 11C-PIB PET measures the density of b-amyloid deposits. Source: David Nutt, Imperial College London.
Drug- receptor occupation studies
Due to the breakthrough advances in imaging techniques, it is now possible noninvasively measure binding of drugs to their target receptors. For a range of drugs used in neurology and psychiatry we can now perform a form of dose-response measurement at the precise target site of drug action, a big improvement as previously we had to make estimates of brain target engagement from plasma concentration measurements. In fig. 8, this is shown for a D2 receptor antagonist. Both scans use 11C-raclopride to estimate the number of dopamine D2 receptors available for the tracer to bind to. In the untreated state a high level of 11C-raclopride binding is seen in the dopamine rich striatal regions. However, after treatment with a D2 receptor antagonist neuroleptic this is dramatically reduced because the drug competes with 11C-raclopride for the same binding site.
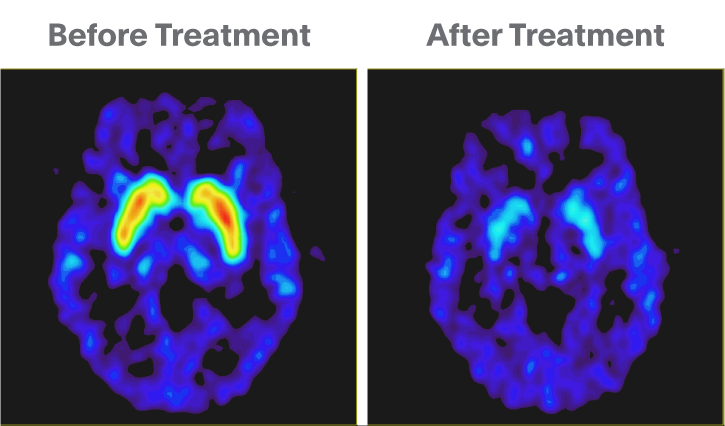
Figure 8.
Using 11C-raclopride PET to estimate receptor occupation of a D2 receptor antagonist used in the treatment of schizophrenia. Left: Before treatment. Right: After treatment. Source: David Nutt, Imperial College London.
Studies such as these were instrumental in changing the dosing regimens of dopamine blocking drugs for psychosis because they revealed several important facts. First the receptor occupation needed to produce an antipsychotic effect was about 65%. But when occupation reached over 80% then adverse effects such as extra-pyramidal symptoms and elevated prolactin concentrations were seen. This means that the therapeutic window for these drugs is very narrow9. Even a small increase in dose can switch a patient from being underdosed [i.e. occupation < 65% ] to overdosed [i.e. occupation > 80%].
The second advance was that it became apparent that certain doses of D2 receptor antagonist produced saturation of the dopamine receptors. Thus, there was no added clinical benefit when adding more of the antagonist, in fact adverse effects were more common. When doses were reduced to lower D2 receptor occupancy the safety and tolerability profile of these drugs improved.
Imaging of the serotonin reuptake site has shown rather different results because here it is necessary to get over 70-80% occupation by a reuptake blocker to produce significant lifting of depression10. Different receptor occupation/effect relationships apply to different drugs; so the full mu receptor opioid agonist methadone produces it actions with very low [less than 8%] occupation of the receptors whereas the partial mu receptor opioid agonist buprenorphine requires occupation of > 50% of receptors11.
Conclusion
PET and MRI imaging offer important new ways to explore brain structure and function in psychiatry and neurology. At present whilst MRI is in regular clinical use for diagnosis, PET is largely just a research tool, but some tracers e.g. F-DOPA and 11C-PIB are being used to aid diagnosis of Parkinson’s disease and Alzheimer’s disease respectively. The future development of tracers that use 18F instead of 11C will further spread the availability of these in clinical practice. This is because the much longer half-life of 18F [110 min v 20min] allows production of the radioactive tracer at a central cyclotron site with distribution to multiple hospitals that have PET scanners. In contrast 11C tracers have to be made on the same site as the scanner, so each site needs its own cyclotron.
Access collection: Brain imaging for psychiatrists: A series of articles
Related content

Professor Christoph Correll discusses the complexities of bipolar disorder, shedding light on the real-world challenges in treatment, the critical role of clinicians, and the necessity of patient-centric approaches in psychiatry.

Bipolar disorder is a chronic and highly debilitating mental disorder characterized by recurrent mood episodes. A major challenge is its heterogeneous clinical presentation with diverse comorbidities and symptomatology.

To study intra-disease variability in cognitive function, researchers employ data-driven clustering methods to differentiate patients with widespread cognitive abnormalities from patients who are cognitively intact.