
Brain imaging technologies have advanced massively in the past two decades. Modern tools such as positron emission tomography (PET), magnetic resonance imaging (MRI) and magnetoencephalography (MEG) allow us a much clearer view of how the brain works: we can almost literally “look inside the skull”1. This article introduces the different forms of imaging and give examples of how we can use them to ask important questions in psychiatry and neurology.
What techniques do we have?
We can consider imaging techniques from several perspectives. One is based on the detection instruments or technology used. Another is the kinds of signal that can be detected whether structural or functional or metabolic and yet another approach is to explore what they can be used for.
PET = positron emission tomography and its close cousin of SPECT = single photon emission computerised tomography– are used to explore brain activity and drug binding and thereby receptor localization2.
These techniques use radiolabelled tracers such as 11Carbon or 18Flourine for PET or 99Technecium metastable (99Tcm) or 123Iodine for SPECT. These unstable radionuclides decompose in the brain giving out 2 gamma rays in the case of PET or a single photon in the case of SPECT and these electromagnetic rays are detected by sensitive photocells arrange in a ring around the head. These techniques can be used to explore changes in either blood flow [eg with 15O water or 99TmHMPAO] or in cellular metabolic activity [using the uptake of 18F-deoxyglucose to assess glucose metabolism].
![*add new title - A PET scan of GABA-A receptor subtype [the alpha5]](https://neurotorium.org/wp-content/uploads/lundbeck_campus_imaging_part_1_170228_html_47da688d_1.jpeg)
Figure 1.
A PET scan of a GABA-A receptor subtype [the alpha5]
Source. David Nutt, Imperial College London.
In some cases it is possible to attach a radiotracer to a drug and so measure its entry and distribution in the brain. If the drug has high affinity for a receptor/reuptake site/enzyme then the density of these can be estimated in discrete brain regions from the radioactive signal in each – fig 1. Currently we have good tracers for estimating the density of a number of receptors for the dopamine 5-HT opioid and GABA-A systems; some of these are described in more detail in Part 2. The time resolution of the PET/SPECT signal is in the order of minutes.
MRI = magnetic resonance imaging– is used to analyse brain structures.
MRI is a technique that relies on having hugely powerful magnetic fields that are used to align molecules of water and other brain components that have paramagnetic properties. The MRI scanner generates a magnetic field that excites hydrogen nuclei (ie, spins), which results in excited spins that induce an electrical voltage in receiver coils placed around the human body or head. The resulting excitation will differ depending on tissue composition (eg. water or fat) of different regions and it can give a number of measures of brain structure (often called structural imaging; fig 2). This is used to help make diagnoses in neurological and psychiatric disorders, eg tumours, stroke and dementias. Compared with other imaging modalities, MRI produces more clear images of tissues, fluids, and fat. Depending on the magnet strength (higher the magnetic field, higher the precession frequency) and duration of scanning (longer the echo time, the stronger the signal is)] resolutions of millimetre scale can be obtained – so allowing analysis of specific sub fields of brain regions eg hippocampus. Most human research centres now use scanners with 3Tesla (3T) magnetic strengths, and some centres have 7T strength scanners. Small animal scanners need smaller diameters and can be made with magnets of even higher strength giving even greater resolution.
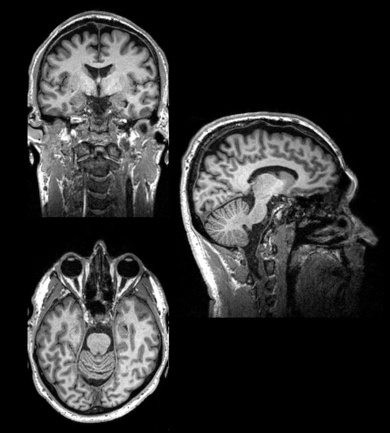
Figure 2.
The structure of a normal human brain revealed by MRI
Source. David Nutt, Imperial College London.
fMRI = functional magnetic resonance imaging– is used to evaluate the brain regions engaged in specific tasks.
FMRI uses the change in magnetic properties of haemoglobin after it loses it oxygen atoms to measure alterations in local blood supply [often called the BOLD signal – blood oxygen level dependent signal]. The time resolution of the BOLD signal is in the order of several seconds. This is the workhorse for modern neuroscience research that wishes to understand the regions of the brain engaged in specific tasks. For this reason some have dubbed fMRI the new phrenology! As brain regions are engaged in a task then the bold flow increases and this changes the magnetic signal in that region. Moving a thumb repeatedly will increase the BOLD signal in the motor cortex for example. fMRI can look deep into the brain to investigate regions that had previously been inaccessible. One of these widely studied is the amygdala because when subjects are shown fearful images a reliable increase in BOLD signal is produced and this response is exaggerated in people with depression and suppressed by treatment with selective serotonin reuptake inhibitors (SSRIs). One recent use of fMRI BOLD is to test if people who are in a coma have a degree of consciousness; they can be asked to imagine playing a sport and if the motor cortex then shows increased BOLD activity we can infer they are conscious.
phMRI = pharmaco-MRI– is used to map brain function in response to a pharmacological stimuli.
With this technique the change in signal [usually BOLD but can be ASL (arterial spin labelling) and also CBV (cerebral blood volume)] is used as a measure of drug effects in the brain. There are a growing number of pharmacological studies demonstrating that many drugs alter BOLD activity in some brain regions3. So for example stimulant treatment has been shown to alter the BOLD responses to cognitive tasks4. The SSRI-induced release of prolactin was found to correlate with increased BOLD signal in the hypothalamus5. The study of drug effects on resting state networks [described more in Part 3] is providing some unique profiles into the differences between different classes of drugs. phMRI is now becoming widely used in the early human development of CNS drugs, for both neurological and psychiatric indications.3
MRS = magnetic resonance spectroscopy – is used to measure biochemical changes in the brain.
MRS is used to measure the concentrations of certain biological molecules in the brain. The atoms within these molecules resonate at specific frequencies according to the specific bonds between them, so each has its own fingerprint within a larger spectrum. Higher magnetic field strengths improve the resolution of the spectra, but overlap of the signals of various molecules usually means scanning a large voxel (3x3x3 cm3) is required to obtain reliable data.
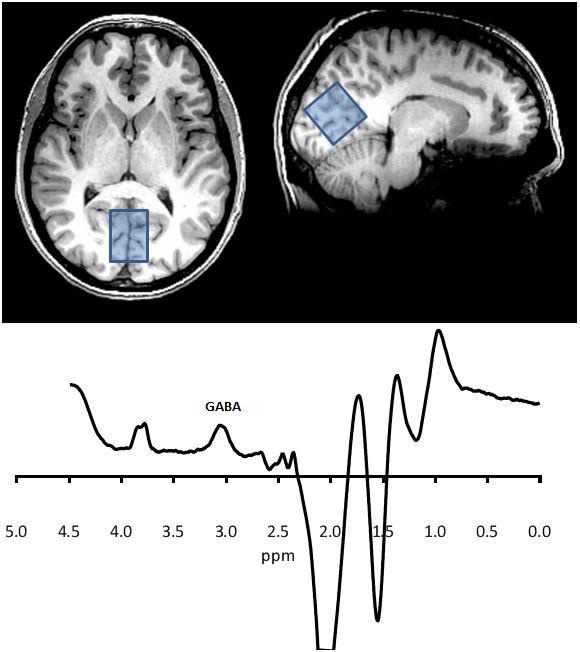
Figure 3.
An MRS recording – peaks give a measure of the concentration of different substances
This fig shows a spectrum analysed in such a way as to enhance the signal from the specific resonances in the GABA molecule. The area under the GABA peak represents its concentration in the large occipital voxel shown. Other peaks can be defined that represent other molecules such as glutamate, creatinine, choline and N-acetylaspartate.
Source. David Nutt, Imperial College London.
MRS can measure levels of certain metabolic substances such as NAA (n-acetylaspartate) and creatinine and glutamate/glutamine. At higher magnet strengths, e.g. 3 Tesla and above then other substances such as GABA can be measured, fig 3. However it is not yet clear that changes in GABA concentration reflect increased levels in the synapse because most of GABA in the brain is in the metabolic pool.6
Currently the clinical applications of MRS are limited but it is used to explore changes in metabolic pathways e.g. in dementias and in some genetic disorders. Alterations in brain glutamate have been detected after some drug treatments e.g. with the glutamate receptor blocker ketamine.7
ASL = arterial spin labelling – is used to measure cerebral blood flow.
In ASL water protons in arterial blood are magnetically tagged. After blood is labelled, it flows into capillaries. There the blood gives a perfusion signal upon image acquisition.
ASL is often used in pharmacological MRI experiments to ensure that there is no direct effect of drugs on blood flow that might confound interpretation of the effects on the BOLD signal. However for some drugs a regionally specific ASL signal can provide clear measures of drug actions. Examples of this are given in Part 2.
DTI = diffusion tensor imaging – is used to measure the brain white matter tracts.
DTI uses MRI tuned to measure axonal tracts in the brain. They can do this because the movement of water in nerve axons is constrained by the fatty sheaths of the neurons so is less perturbed by the radio-pulses than the rest of the water molecules in the brain.
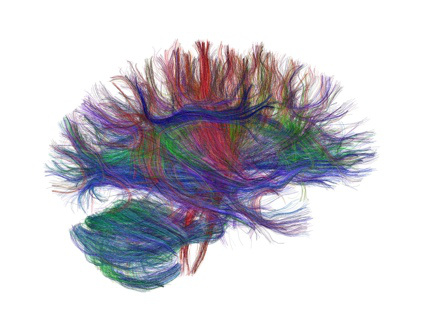
Figure 4.
Brain axonal pathways revealed by DTI imaging
Source. David Nutt, Imperial College London.
Fig 4 gives an example of how this approach can provide beautiful images of the fibre tracts in the brain. Though a newer tool, DTI is beginning to be used as a research and diagnostic tool since it measures are capable of quantification and so can be subject to statistical comparisons.
EEG – electroencephalography – is used to measures electrical connectivity of the brain from a series [often 32 to 256] of surface electrodes.
EEG has a very fast time resolution of a few milliseconds and is generally assessed in terms of activity in a range of different frequency bands ranging from 1-4 hz [delta] 4 -7 hz [theta] 8-14 hz [alpha] and 14 —30 hz [beta]8, though the high frequencies are susceptible to artefacts from electrical activity of muscle so are less reliable than those from MEG9. EEG has a long track record as a diagnostic tool for identifying epileptic foci. It is also a vital tool for assessing the different stages of sleep each of which have a clear and discrete EEG profile.
MEG – magnetoencephalography – is used to measure magnetic fields in the brain.
MEG assesses the magnetic fields that neuronal electrical currents produce. These magnetic detectors are called SQUIDS (superconducting quantum interference device) and usually 102 and often more of them are arranged in a head-covering shell that can be lowered onto the person’s head. MEG has a very fast time resolution of a few milliseconds. MEG can mainly reliably measure activity in the cortex but has the advantage of being less susceptible than EEG to artefacts from blinks and muscle potentials that badly interfere with the high frequency [>30hz] EEG signal (fig 5). MEG can reveal very distinctive differences in oscillatory power in different brain regions after treatment with different drugs (see Part 3 of this series). These “brain-prints” of each drug are akin to human fingerprints in that there is a unique profile for different types of drugs. They also help explain the very clear variants in subjective effects that different drugs produce.
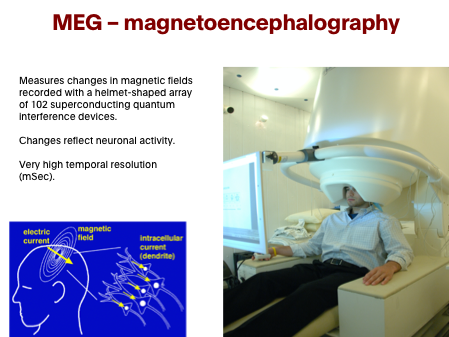
Figure 5.
The principles and practical use of MEG.
Source. David Nutt, Imperial College London.
PET and MRI techniques have the drawback [at present] of requiring the person to be lying down, and having their head in a tube can be claustrophobic for some people. MEG and EEG are used in the sitting position, which may be more comfortable for patients and better for studies where real-world types of interactions are desired eg performing tasks on a computer. Nevertheless people have become very clever in adapting research tools to apply in the flat-scanner environment and it is now possible to have subjects interact with videos and computers using projectors and mirrors. One Swedish group even managed to run a social interaction task to measure social anxiety in a PET scanner – they had the patients make a speech lying down.
Access collection: Brain imaging for psychiatrists: A series of articles
Related content

Professor Christoph Correll discusses the complexities of bipolar disorder, shedding light on the real-world challenges in treatment, the critical role of clinicians, and the necessity of patient-centric approaches in psychiatry.

Bipolar disorder is a chronic and highly debilitating mental disorder characterized by recurrent mood episodes. A major challenge is its heterogeneous clinical presentation with diverse comorbidities and symptomatology.

To study intra-disease variability in cognitive function, researchers employ data-driven clustering methods to differentiate patients with widespread cognitive abnormalities from patients who are cognitively intact.