
Neuroimaging: From see-saws to the scanner
For more than 100 years, psychiatry has sought to understand how changes in the brain result in thoughts, subjective experiences and ultimately psychiatric disorders. The idea that brain activity was relevant to the human mental state goes back millennia (if we accept the evidence of trepanning in cave-dwellers). In the late 1800s, William James, one of the founding fathers of psychology, developed a means of estimating brain blood flow using the “human circulation balance” on which a person was stabilised in the horizontal plane. When they were then given a task such as mental arithmetic the head end of the “human circulation balance”, as developed by Angelo Mosso, began to lower towards the ground, indicating increased blood flow in the brain resulting from mental effort. The modern MR techniques of arterial spin labelling (ASL) and functional magnetic resonance imaging (fMRI) discussed in the preceding articles as they pertain to some disease states, work on the same principles: if a part of the brain is engaged in effort then increases in blood flow can be imaged.
Towards a better understanding of psychiatric disease through neuroimaging
Prior to the advent of other imaging techniques, including fMRI, studies examining cortical blood flow were conducted using PET imaging either with 18-F-deoxyglucose or 15-O-water tracers. The resultant images, however, did not have as good time resolution as fMRI but 15-O-water – if used in a block design such as presenting a series of anxiety-provoking stimuli contrasted against a safety signal – could also identify brain circuits underpinning fear, anxiety and alterations in mood. Figure 1 shows one such study comparing anxiety circuits in patients with conditioned anxiety with those of patients with social anxiety disorder.1 You can see that there is a large overlap in the regions involved in the two groups with classic anxiety-related areas, including the insula and anterior cingulate cortex which show increased activity. However, the patient group showed activity in two regions that were not activated those with conditioned anxiety. We believe these are relevant to the specific anxiety cognitions of social anxiety patients as the prefrontal region and the temporal region are involved in affective response planning and body position awareness, both of which are central to social anxiety disorder.
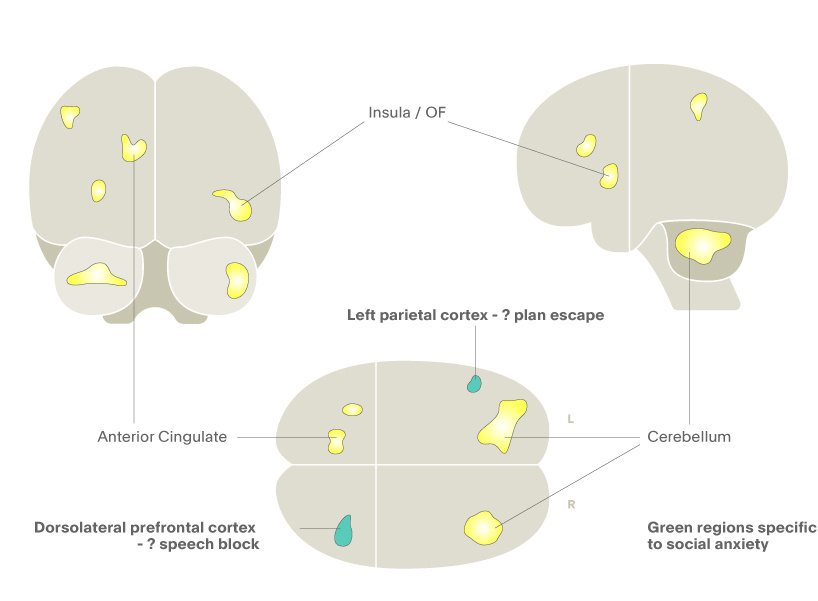
Figure 1. 15-O water PET in social anxiety disorder. Yellow regions represent blood flow in both conditioned anxiety and social anxiety disorder, while the green regions represent increased blood flow only in patients with social anxiety disorder.1
The now standard approach in much of clinical neuroscience of using ASL and fMRI has also been used to plot the brain circuits underpinning sensorimotor, visual and auditory functions and more recently psychological processes. Perhaps the most well-known is that of amygdala activation to threat stimuli. When exposed to a threat such as a fearful face or other aversive emotional stimuli, the amygdala orchestrates the brain at a sub-conscious level to prepare for an escape response. This action of the amygdala results in increased blood flow and is measurable via fMRI, as shown in Figure 2. This figure illustrates the results of presenting healthy volunteers with unpleasant images from the international affective images battery compared with amygdala activity produced by neutral images. One can see that there is a significantly increased fMRI BOLD signal in the visual association areas (where the content of the unpleasant images reaches consciousness) but also in the amygdala bilaterally (where the defence response is orchestrated). Such activation of the amygdala to threat is increased in people with depression and is markedly attenuated by drugs that treat depression. This effect of antidepressant drugs is seen early in treatment which leads some to believe that this is how such treatments work – the damping down of the amygdala activity protects the brain against stress-related impairments and so allows it to recover which in turn leads to the clinical antidepressant effects.
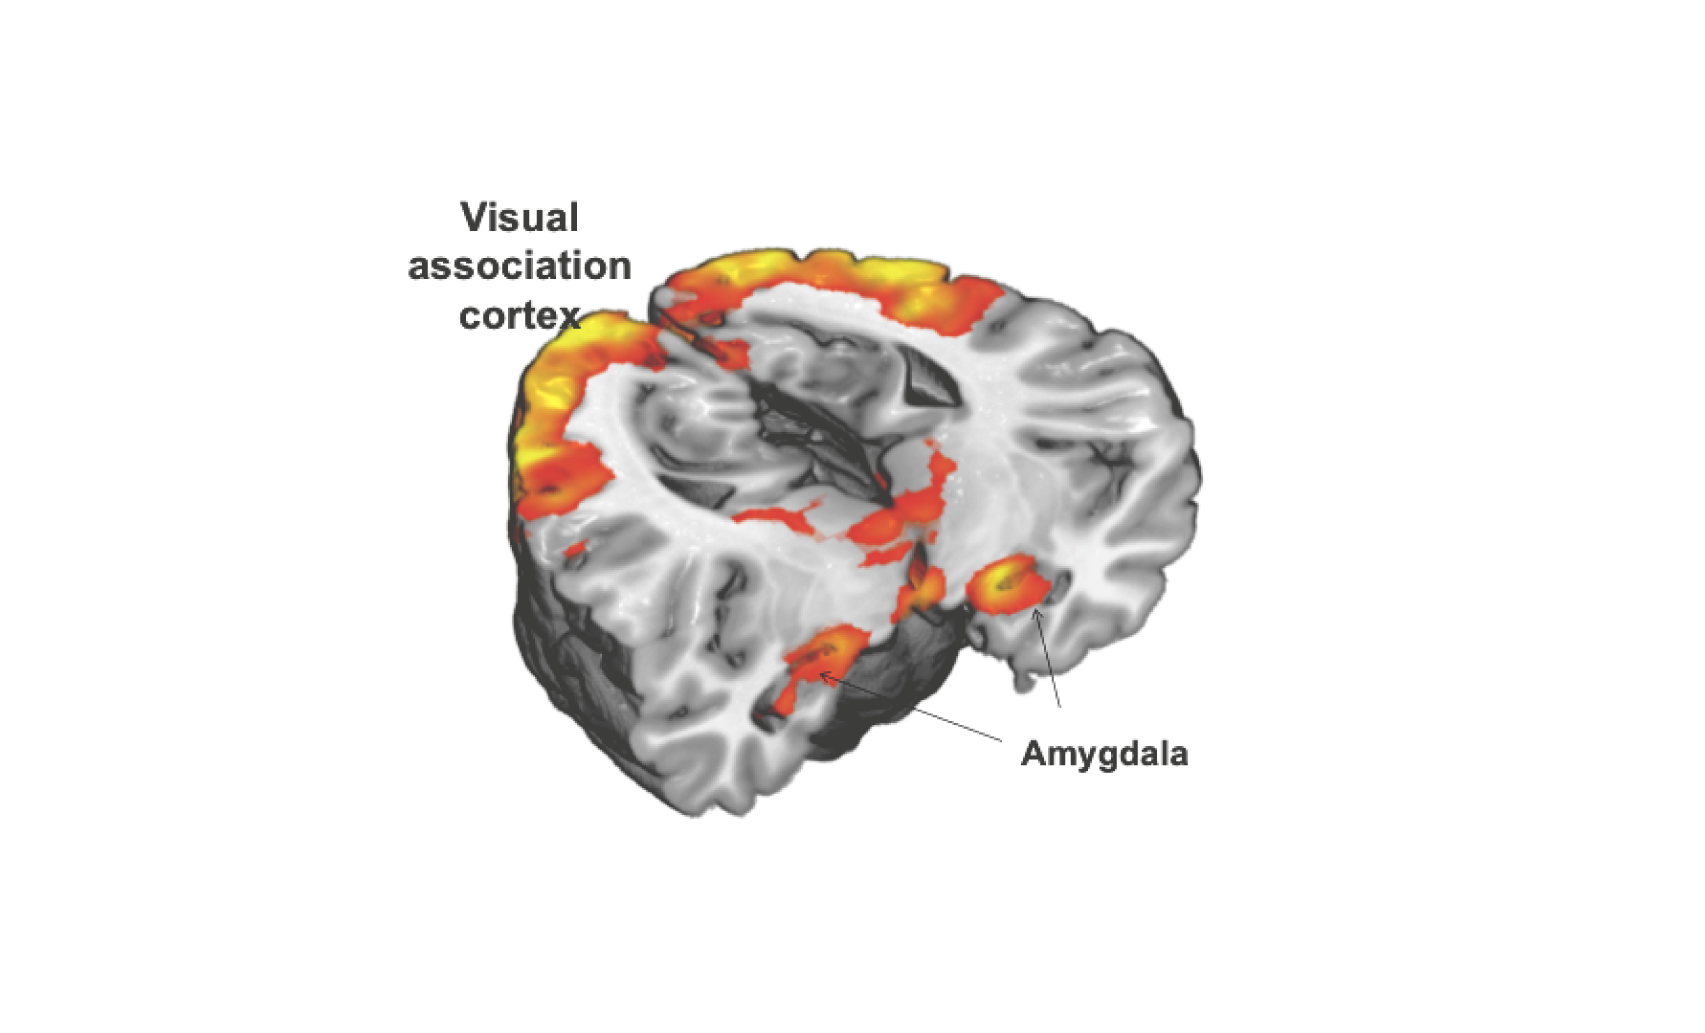
Figure 2. Amygdala and visual association cortex activation provoked by viewing emotionally evocative images in an fMRI BOLD paradigm (image per Prof Nutt, Neuropsychopharmacology Unit, Imperial College, London).
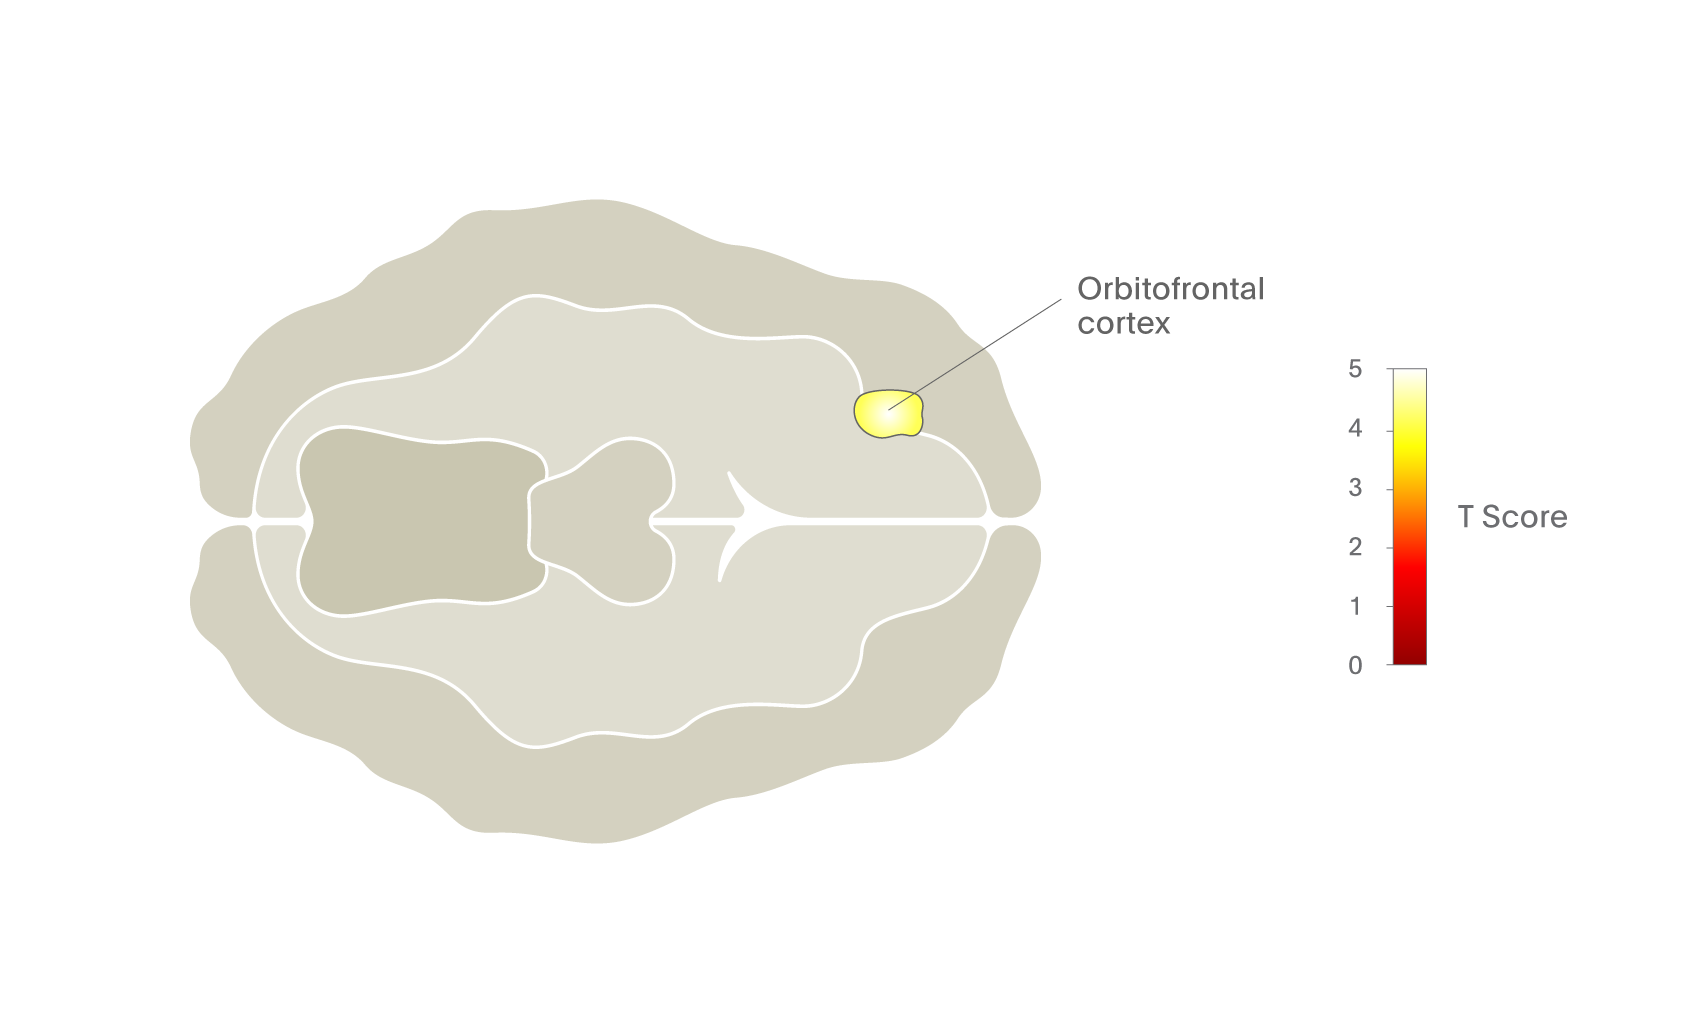
The beauty of this form of brain imaging is that it can be used to explore the brain regions and circuits involved in a range of subjective states. For example, Figure 3 shows areas of the brain activated in abstinent opiate-dependent subjects when they are craving the drug.2 This is one of several studies that have implicated the orbitofrontal cortex in drug craving and thus in addiction.3,4
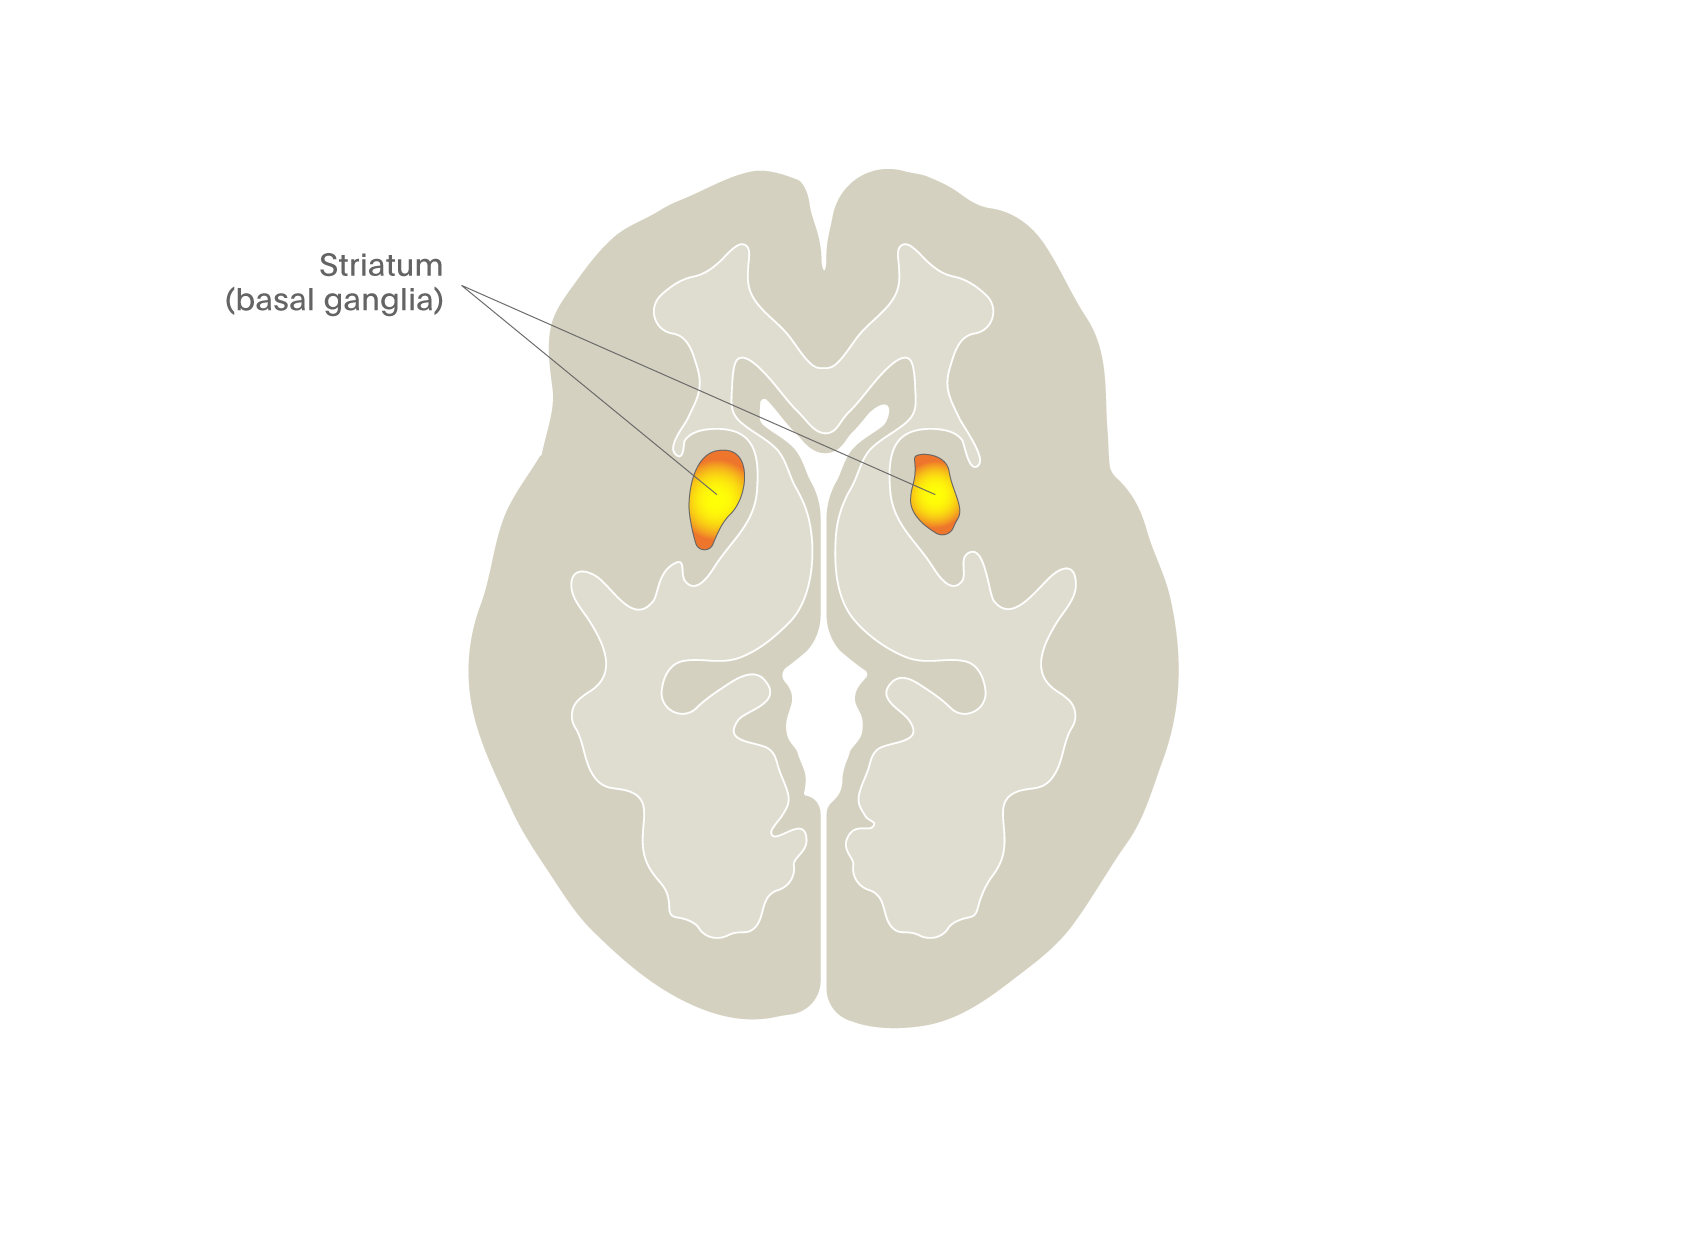
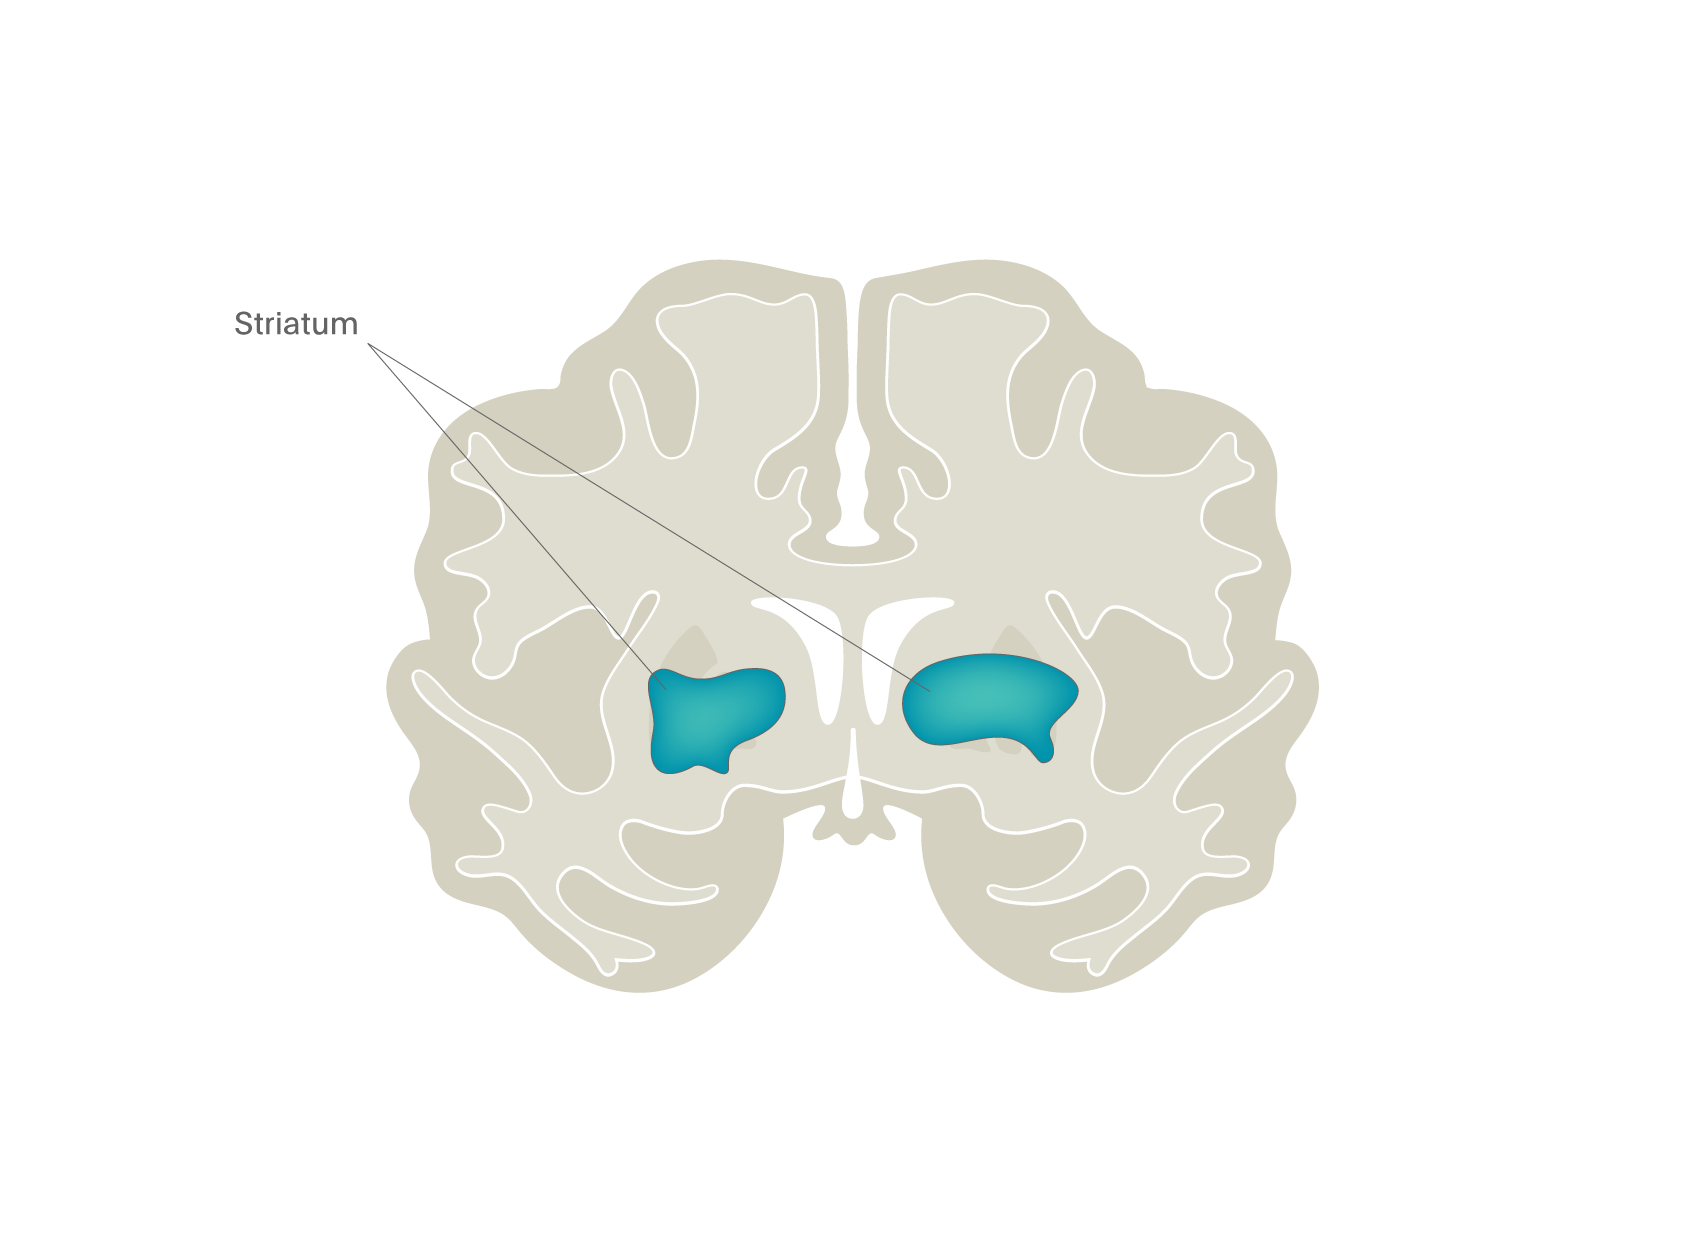
Another approach to addiction research has been to devise tasks that activate the dopamine pathways implicated in the actions of some drugs, particularly stimulants and alcohol. The most famous of these is the monetary incentive delay task (MID) in which participants can win money if they respond fast enough to a visual cue5. As you can see in Figure 4, this task has a profound activating effect on the striatal region where most of the dopamine neurons project, suggesting that they are involved in motivated behaviour.
Pharmacological challenges
The value of imaging to reveal drug effects on specific brain regions has been understood for decades but there have been relatively few studies of pharmacological when compared with psychological challenges. A rather surprising example of the impact of a drug on brain function emerged from our recent studies of psychedelic drugs. Previous research has illustrated that psychedelic drugs produce profound alterations of consciousness with vivid elementary hallucinations and out-of-body experiences. We therefore assumed that these effects would be associated with an increase in activity in the visual cortex, however, to our surprise, the impact of both these drugs was to reduce activity in core brain areas, particularly the anterior and posterior cingulate cortices and thalamus. This is shown in Figure 5, where BOLD measures revealed no brain regions with increased activity but rather very clear decreases6. We now understand that psychedelic drugs decrease activity in the key brain nodes that regulate integrated brain function, allowing a less constrained, more entropic state to emerge. This suggests that the old adage that psychedelics “turn on” the brain may be not entirely correct – in fact, it appears that they reduce activity is some parts!
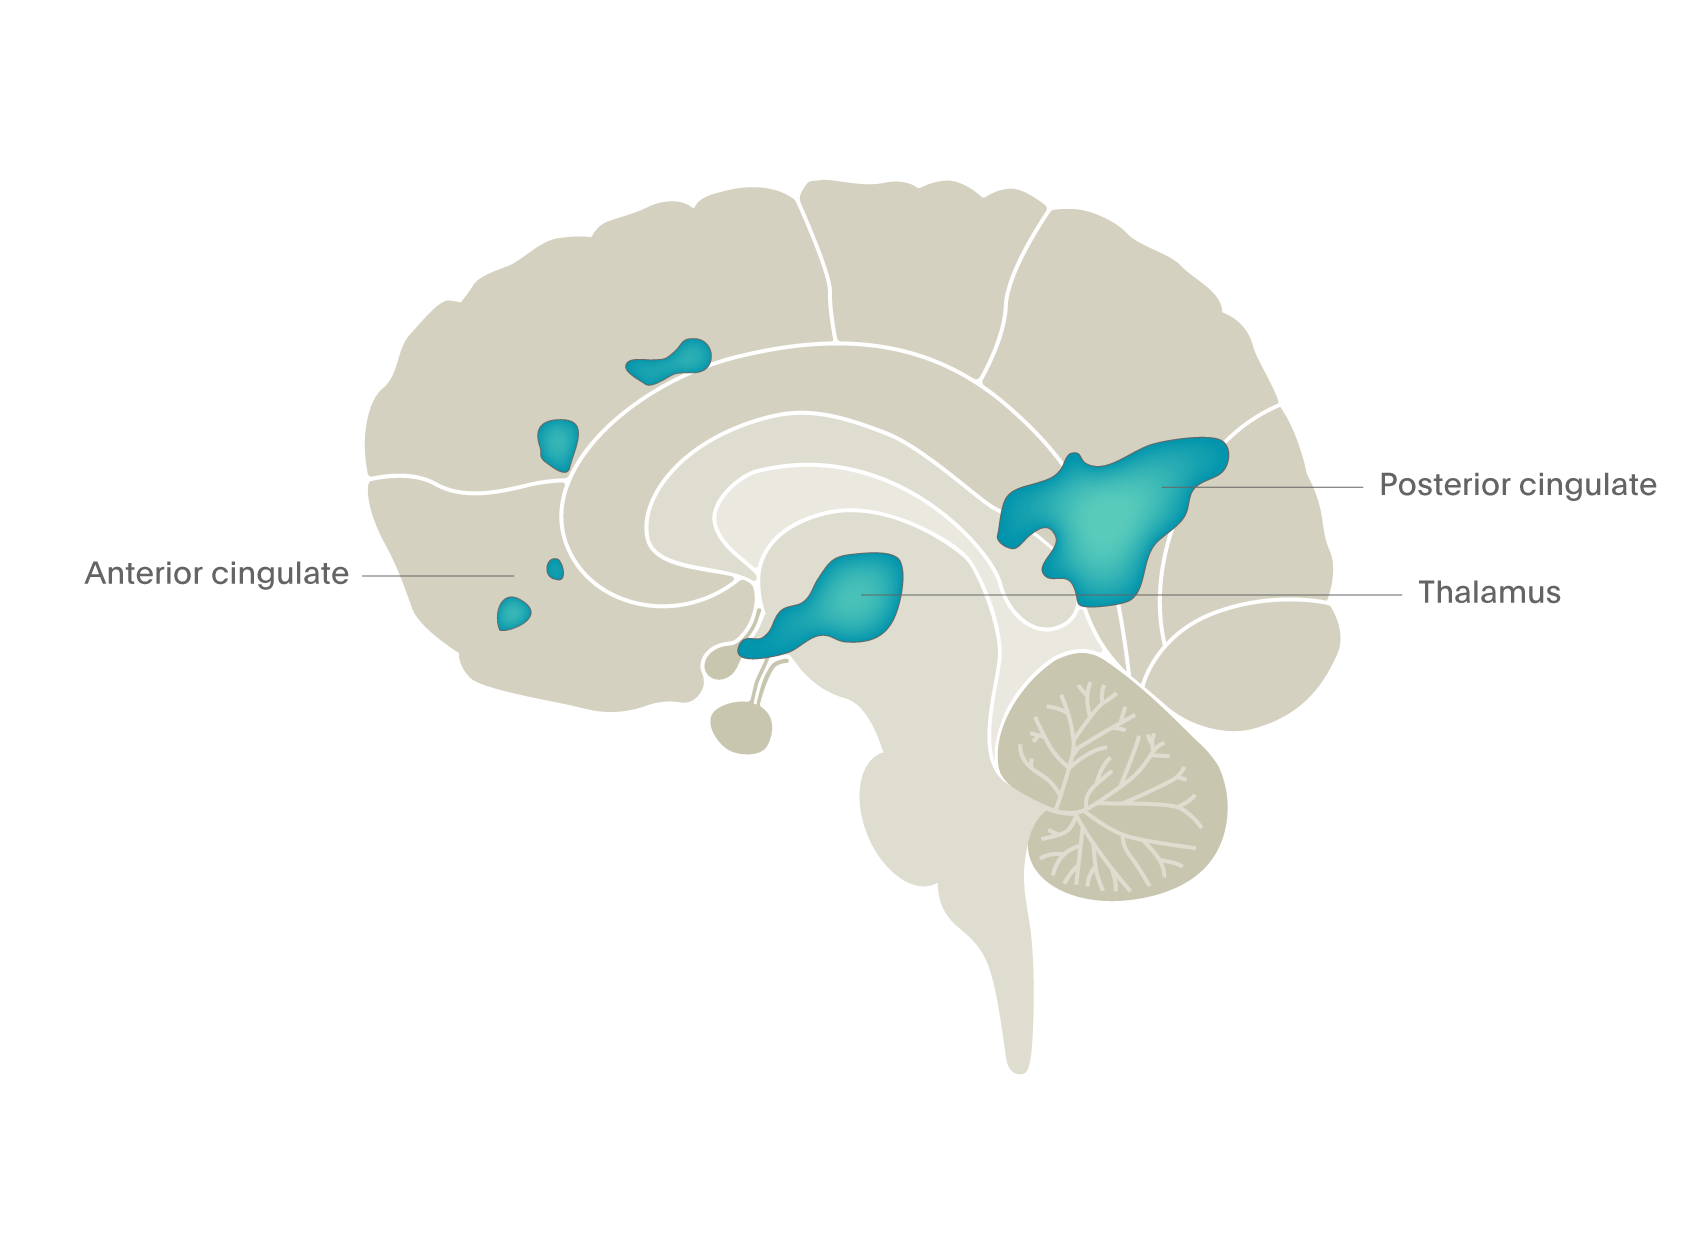
Figure 5. Psychedelic drugs turn off brain activity in the cingulate regions and thalamus – fMRI BOLD image (Carhart-Harris et al., 20126).
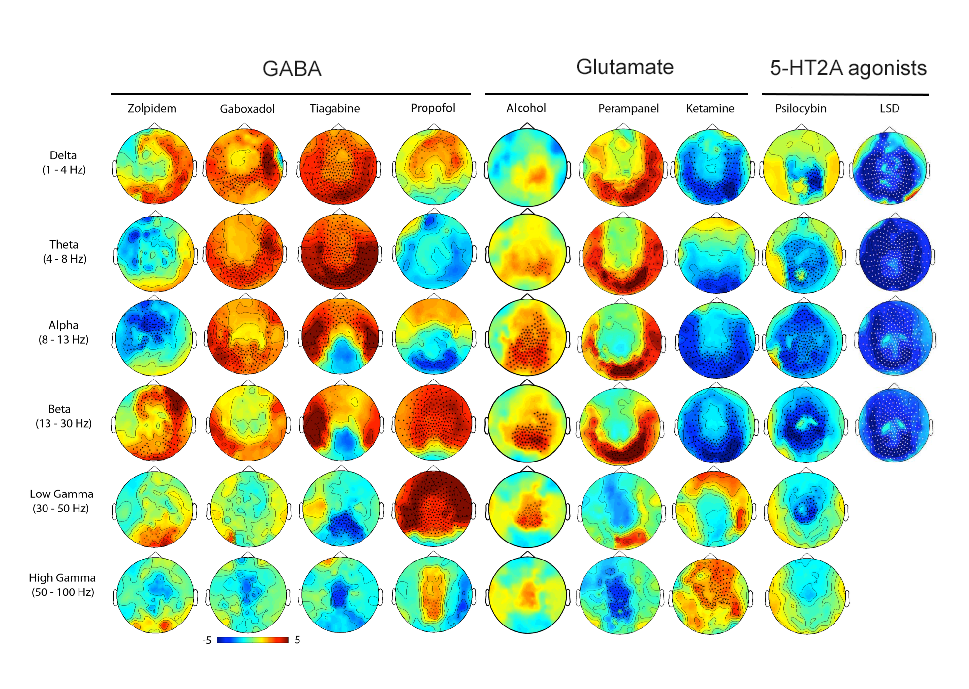
Systematic research on the effects of drugs on brain functioning comes from a series of studies using magnetoencephalography (MEG), illustrated in Figure 6. Using MEG, increased power in the different frequency spectra are indicated by a hotter colour [red] and reduced power by a cooler colour [blue]. Statistically significant differences from placebo are indicated by “+” marks. In this example, you can see that GABA drugs tend to increase power, though in somewhat different frequency ranges. They induce a state of increased synchronicity in cortical areas and sedation. In contrast, psychedelic and hallucinatory drugs have exactly the opposite actions, each massively desynchronising brain electrical activity, resulting in a much less organised brain, another indication of the increased entropy found with fMRI imaging studies of psychedelics.

Psychopharmacological challenges
The principle here is to use imaging to explore the impact of a drug to modify the impact of a psychological challenge, either to understand the neurotransmitter roles in brain activity or to develop new treatments. Probably the most common test measure we have already mentioned, namely the ability of drugs with antidepressant properties to supress fear-image activated amygdala activity. In theory, this model could be used to screen for new classes of drugs for depression that also supress such brain activity. In this way, fMRI data would provide a useful intermediate phenotype for antidepressant activity that could provide valuable information (eg. potential side effects, dosing) during the early phases of drug trials and help tailor large-scale trials accordingly. It could also encourage new conceptual approaches to antidepressant drug development as this form of testing in normal volunteers allows for much faster testing of drugs than clinical trials.
Another approach that has been used to explore how established drugs work is shown in Figure 7. Here we studied an opioid receptor antagonist/partial agonist (nalmefene), that reduces binge drinking. But the exact mode of action of this effect was unclear – did nalmefene reduce the motivating effects of alcohol to continue drinking, perhaps through an action on the dopamine system, or did it enhance top-down cortex-mediated regulation of the urge to drink? To compare these two theories, we took alcohol-dependent patients not wishing to abstain completely from drinking and gave them alcohol in the form of an intravenous infusion that raised their blood alcohol level to about 80 mg per 100 ml blood (the current legal limit for driving in the UK) and then held it at this level for an hour. This was done whilst they were in the fMRI scanner on two separate occasions: once when on placebo and once when on nalmefene, an opioid receptor antagonist/partial agonist. During the scans, individuals were exposed to a task that measured motivation (the MID, see Figure 4), as well one that measured their ability to restrain behaviour (a “go/no go” task). The results showed the main impact of drug was to reduce striatal activity in the MID task (see Figure 7)7. This is a good example of how one can use imaging to explore the possible sites and mechanism of action of new drugs.
Resting state connectivity
This is a relatively new construct relating to brain regions and their inter-connectivity that has emerged from the ability of neuroimaging techniques to collect data over time and then compare activity in different regions or even different voxels using statistical modelling. It was first developed using PET measures of blood flow using 15O-water but has come to the fore with the increased availability of fMRI BOLD and EEG measures. The process, often referred to as the ‘resting state’ measure, is simple: subjects are scanned when they are doing nothing. There are no tasks to engage them, so they just rest reflecting on whatever they like; it is required that the patient stay awake. This session usually lasts for several minutes and BOLD data are collected for different regions of the brain. The analysis then explores the statistical relationship of each voxel with all the others in the brain, this is a very computationally-demanding process which can take many hours but delivers a correlation map of connectivity that reveals there are many (up to 12 in some analyses) different networks in the brain. Some of these networks include for example the visual, auditory and sensorimotor networks. However, some previously unknown networks emerged, the most interesting of which being the default mode network (DMN). This is shown in Figure 8 as the two “hot” areas – the frontal region and the posterior cingulate cortex. One can see that the activity in these two regions (the DMN) is closely correlated whereas it is not at all correlated with activity in the visual cortex and, in fact, anti-correlated with activity in the sensorimotor cortex. The DMN is only seen when people are not doing anything other than drinking, once they start to perform an attention-demanding task or open their eyes then activity in other regions increases and that in the DMN reduces.
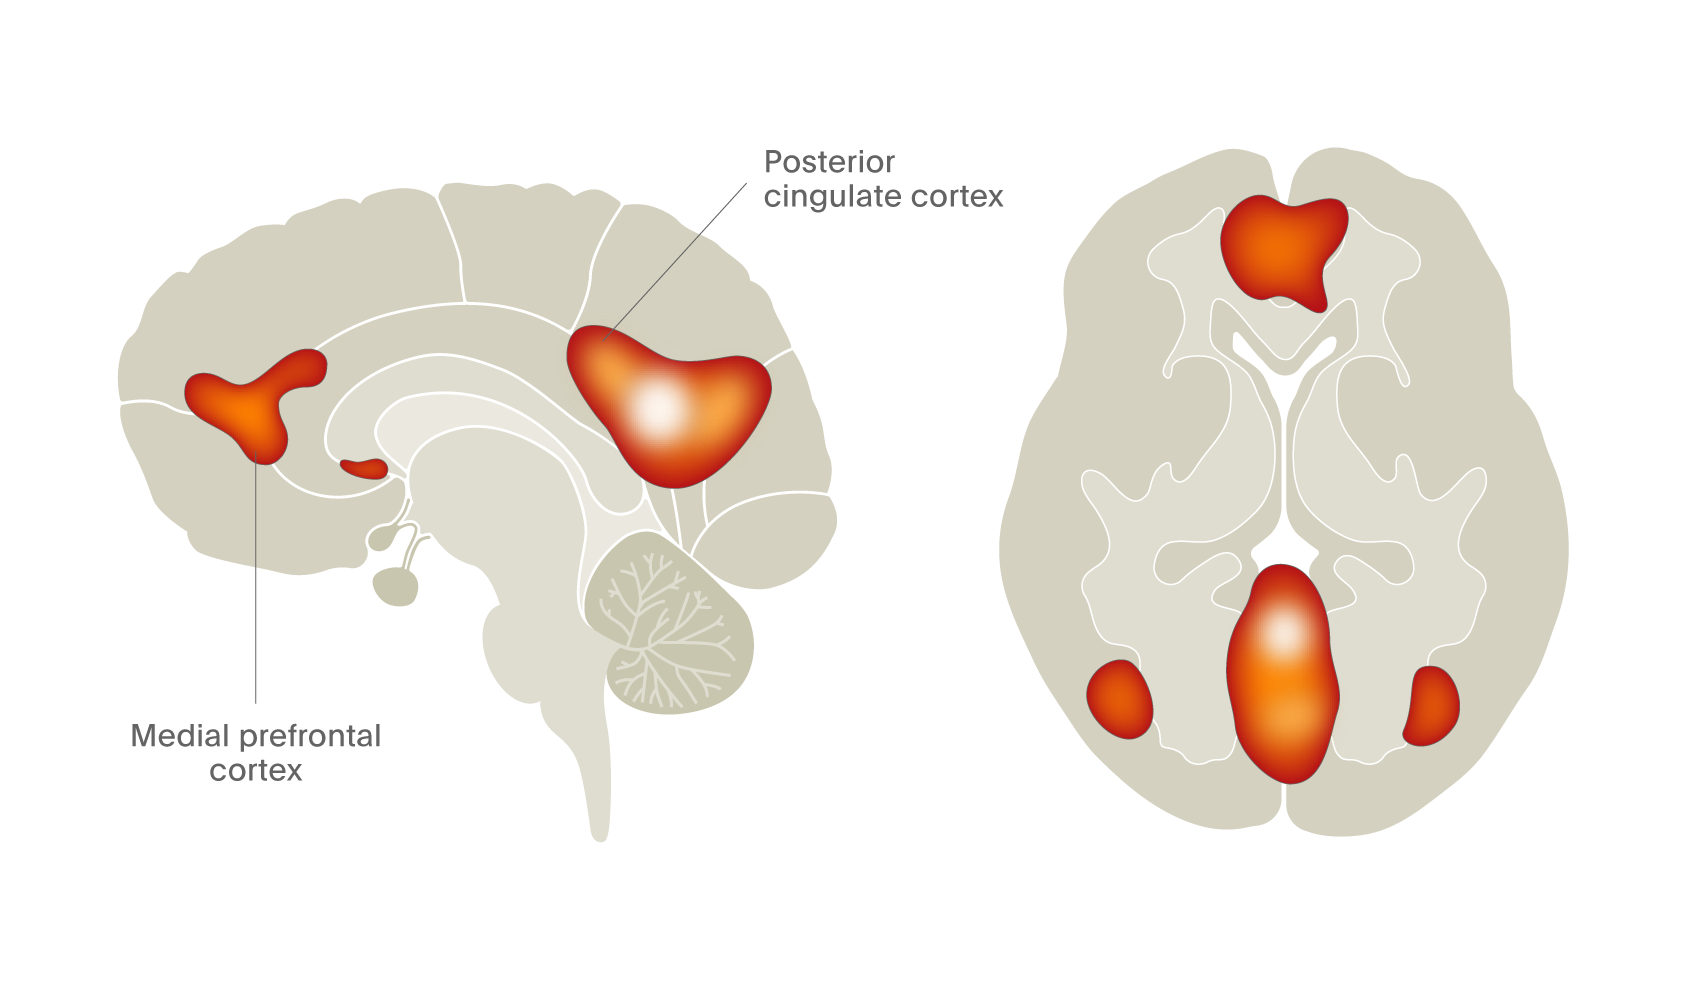
Figure 8. fMRI reveals the presence of the default mode network in living human brain (Davey et al., 2016).8
Since the discovery of the DMN, it has become one of fastest growing topics in neuroscience relating to psychiatry as – for the first time – it locates the site of self-awareness in the brain. We know this because if the DMN is “turned off”, for example with psychedelics (Figure 5; Carhart-Harris et al., 20126), then the sense of self is profoundly altered. Moreover, in conditions where there is self-referencing and self-construct, the DMN is more activated and consumes more brain space. We now believe that the DMN is probably the site of what Freud would call the “ego”.
Conclusions
We hope you have enjoyed this short tour through the techniques of neuroimaging and the discoveries we have made so far, and that these approaches offer a unique insight into brain function and dysfunction for psychiatry (see also Part 1 and Part 2). We can only hope that they will also lead to improvements in diagnosis and treatments for our patients over the next few decades.
Access collection: Brain imaging for psychiatrists: A series of articles
Related content

Professor Christoph Correll discusses the complexities of bipolar disorder, shedding light on the real-world challenges in treatment, the critical role of clinicians, and the necessity of patient-centric approaches in psychiatry.

Bipolar disorder is a chronic and highly debilitating mental disorder characterized by recurrent mood episodes. A major challenge is its heterogeneous clinical presentation with diverse comorbidities and symptomatology.

To study intra-disease variability in cognitive function, researchers employ data-driven clustering methods to differentiate patients with widespread cognitive abnormalities from patients who are cognitively intact.