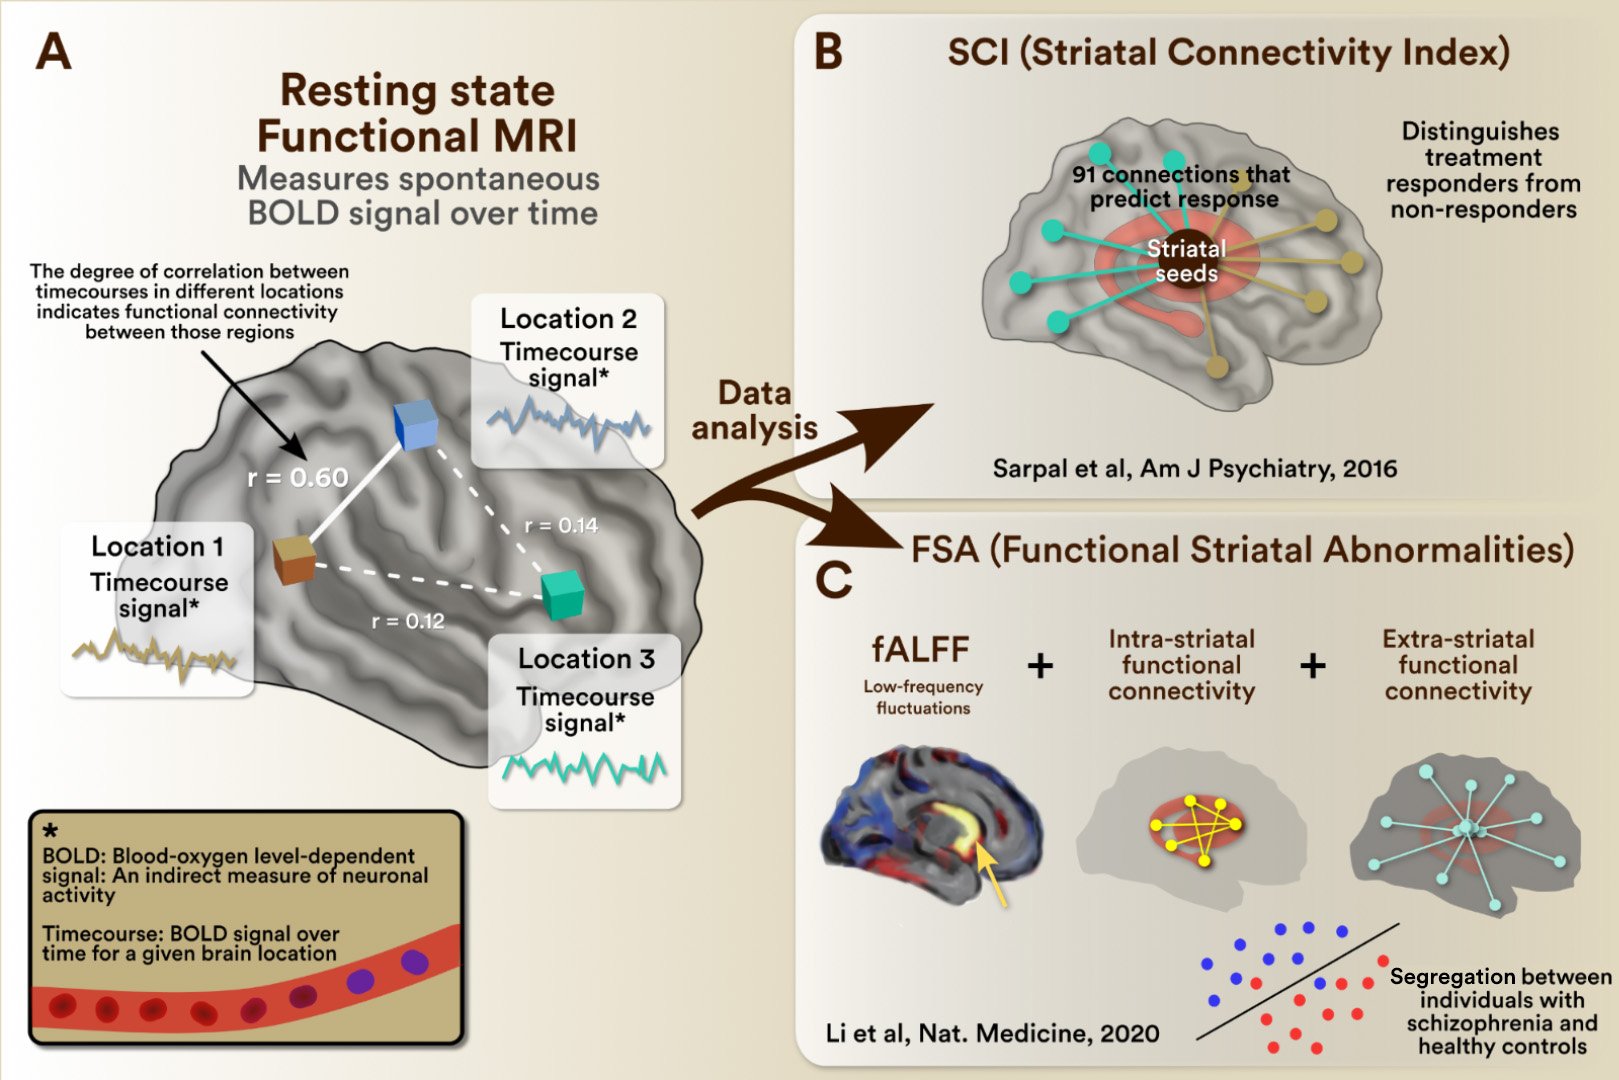
A. Measurement of functional connectivity: Data is collected using resting-state functional magnetic resonance imaging (fMRI). The acquired images reflect the blood oxygen level-dependent (BOLD) signal in space over time. The spontaneous fluctuation of the BOLD signal over time for a given brain region is known as a time series for that region and indicates its neuronal activity over time. The relationship between the timeseries of different brain regions reflects their functional connectivity (I.e., if the signal increases and decreases simultaneously, they are functionally connected). The functional connectivity of regions of interest can be further analyzed (e.g., selecting connections of interest and weighing their functional connectivity strength) to generate individual scores. Exemplars of this approach are the SCI, shown in panel B (Sarpal et al. Am J Psychiatry, 2016), and the FSA, shown in panel C (Li et al. Nat Medicine, 2020)
B. The SCI for a given individual reflects their functional connections in 91 couplets between the striatum and other regions in the brain, which predict treatment response. In the original publication, its individual value had ~ 80% accuracy in predicting future treatment response.
C. The FSA does further processing of functional connectivity (I.e., the striatal fractional amplitude of low-frequency fluctuations (fALFF) analysis, intra-striatal and extra-striatal connectivity) to generate individual scores that can discriminate schizophrenia from healthy controls. In the original publication, individual FSA scores had an accuracy of ~80% separating schizophrenia from healthy control cases.
Click here: Explore Biomarkers in Schizophrenia
Related content


Schizophrenia remains one of psychiatry’s most complex disorders due to its multifactorial etiology, involving interacting biological, psychological, and environmental factors.