

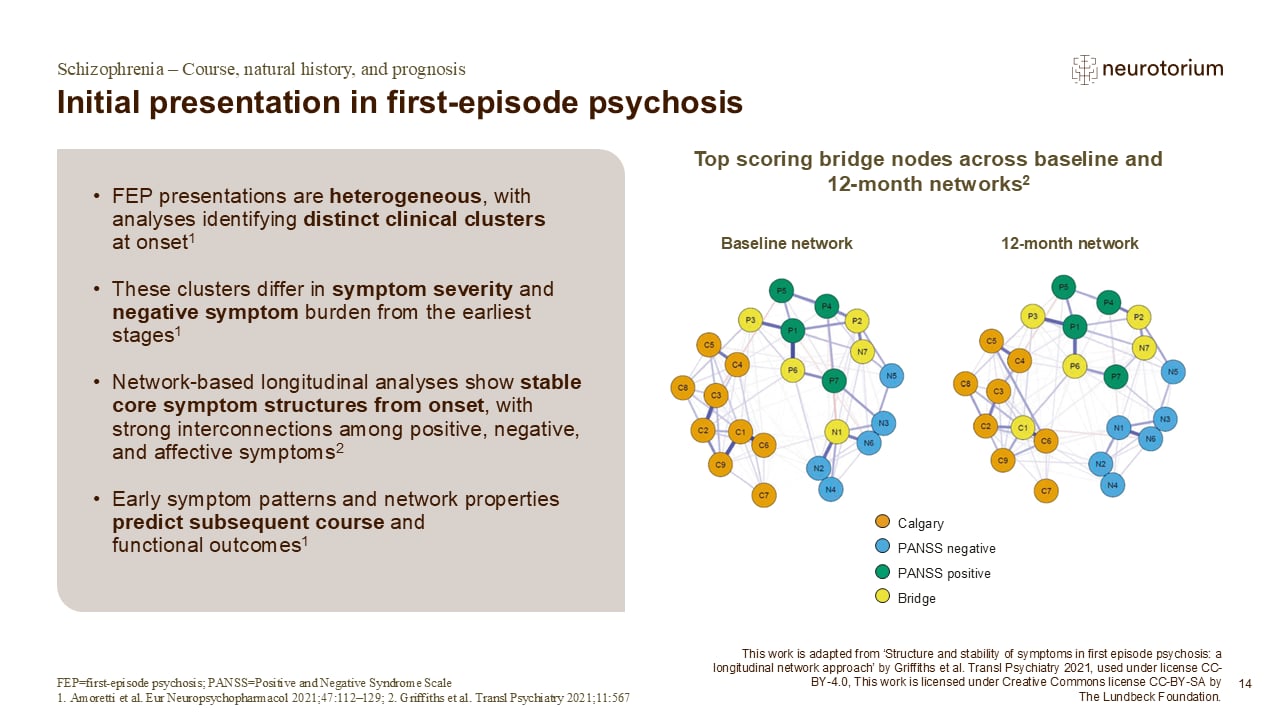
In the figure, each circle (node) represents a symptom, and the lines between nodes represent statistical associations between symptoms.2 Symptoms are grouped by clinical scale: orange nodes represent depressive symptoms from the CDSS, blue nodes represent negative symptoms from the PANSS, and green nodes represent positive symptoms from the PANSS.2 The yellow nodes highlight bridge symptoms.2 These are symptoms that connect different symptom clusters and are important because they may help explain how symptoms from different domains influence each other and may represent potential targets for intervention to reduce overall symptom burden.2 The figure suggests that relationships between symptom domains may evolve during the course of illness and treatment.2 P1=Delusions; P2=Conceptual Organization; P3=Hallucinatory Behaviour; P4=Excitement; P5=Grandiosity; P6=Suspiciousness/Persecution; P7=Hostility; N1=Blunted Affect; N2=Emotional Withdrawal; N3=Poor Rapport; N4=Passive/Apathetic Social Withdrawal; N5=Difficulty in Abstract Thinking; N6=Lack of Spontaneity and Flow of Conversation; N7=Stereotyped Thinking; C1=Depression; C2=Hopelessness; C3=Self Depreciation; C4=Guilt Ideas of Reference; C5=Pathological Guilt; C6=Morning Depression; C7=Early Awakening; C8=Suicide; C9=Observed Depression.
Abbreviations: CDSS=Calgary Depression Scale for Schizophrenia; PANSS=Positive and Negative Syndrome Scale
References:
1. Amoretti S, Verdolini N, Mezquida G, et al. Identifying clinical clusters with distinct trajectories in first-episode psychosis through an unsupervised machine learning technique. Eur Neuropsychopharmacol 2021; 47: 112–129.
2. Griffiths SL, Leighton SP, Mallikarjun PK, et al. Structure and stability of symptoms in first episode psychosis: a longitudinal network approach. Transl Psychiatry 2021; 11: 567.