
Alzheimer’s disease (AD) is a progressive neurodegenerative disorder that results in gradual cognitive decline and dementia. Definitive diagnosis of AD requires an autopsy evaluation of the brain to investigate the presence of amyloid-β plaques and tau neurofibrillary tangles (Figure 1). If these brain pathologies are observed in various brain regions, a diagnosis of AD can be made.1,2 In contrast, only “probable AD” can be diagnosed in living people based on signs & symptoms alone,3 due to the imperfect correspondence between classical AD symptoms (progressive amnestic cognitive impairment with eventual involvement of other cognitive domains) and AD neuropathology. Therefore, it is important to distinguish between two terms: dementia (cognitive impairment that is severe enough to interfere with activities of daily living) and AD (a specific disease defined by amyloid-β and tau pathologies that results in dementia).
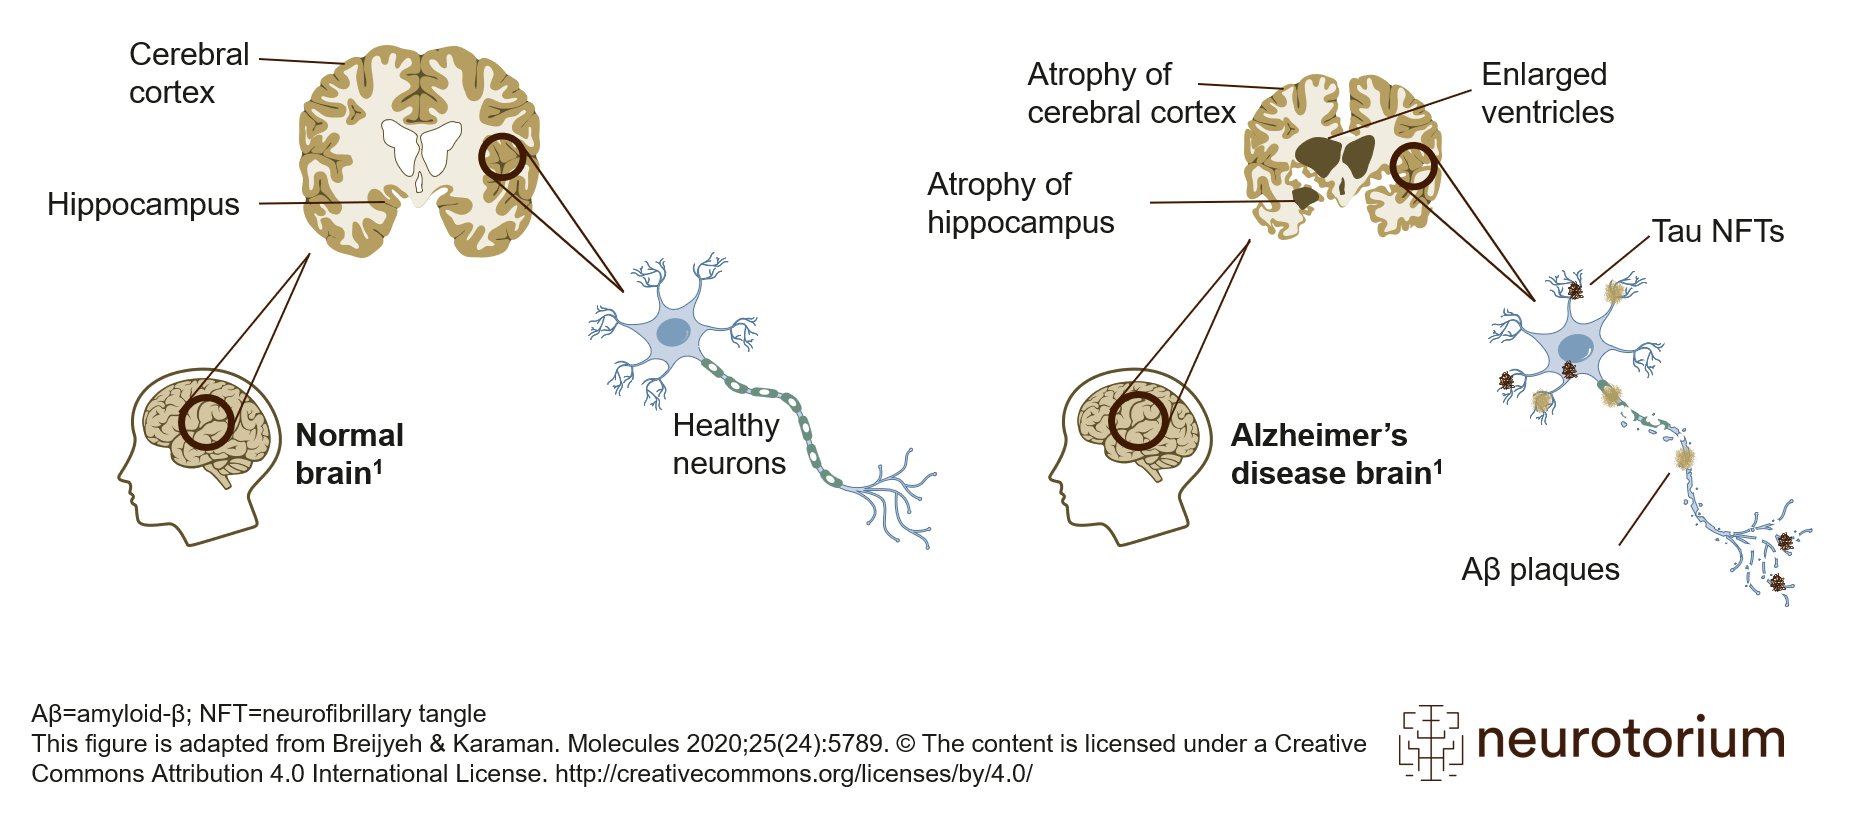
Figure 1: Alzheimer’s disease brain with amyloid plaque and neurofibillary tangles
Schematic representation of healthy brain (left) and Alzheimer’s disease (AD) brain (right). Compared to the healthy brain, the brain with AD, as the disease progresses, features an atrophied cerebral cortex, shrinkage of the hippocampus, and enlargement of the ventricles. The AD brain has two other key features: amyloid-beta plaques and tau neurofibrillary tangles (NFTs). Aβ plaques are located extracellularly, and tau NFTs are located intracellularly. These two pathologies are the defining features of AD and are required for a neuropathological diagnosis of AD. This figure is adapted from Breijyeh & Karaman. Molecules 2020;25(24):5789. The content is licensed under a Creative Commons Attribution 4.0 International License. https://creativecommons.org/licenses/by/4.0/
Because multiple different diseases (often characterized by different neuropathological processes) can result in the same cognitive symptoms,4 identifying AD based on specific symptoms is difficult. A second complication is the growing awareness of “atypical” AD, meaning AD that presents with clinical features that are different from the classical amnestic phenotype.5,6 These “atypical” clinical presentations of AD include behavioural or dysexecutive predominant phenotypes which resemble the behavioural variant of frontotemporal dementia, a visuospatial-predominant AD phenotype termed Posterior Cortical Atrophy and a language-predominant phenotype named Logopenic Primary Progressive Aphasia. For these reasons, even in expert memory clinics, the discordance between clinically-defined “probable AD” and biologically-defined AD is between 15-30%.7,8
With the era of anti-amyloid monoclonal antibody therapies for AD soon upon us, accurately determining which individuals harbour AD pathology is of critical importance. Biomarkers are used to quantify AD pathology in living people, and are anticipated to have an essential role in the differential diagnosis of neurodegenerative diseases. This article will briefly review key AD biomarkers used in both clinical and research settings and conclude by outlining future areas of AD biomarker research and unanswered questions.
With the era of anti-amyloid monoclonal antibody therapies for AD soon upon us, accurately determining which individuals harbour AD pathology is of critical importance.
AD biomarker classes
Broadly, AD biomarkers are generally classified as imaging (Positron Emission Tomography [PET] and Magnetic Resonance Imaging [MRI]), and biofluid (Cerebrospinal fluid [CSF] and blood plasma). Imaging biomarkers have an important advantage: the ability to display the distribution of specific pathologies in the brain. This information can be used for sub-typing and staging AD, both of which are anticipated to provide information about future clinical progression. In contrast, fluid biomarkers have the important advantage of being able to concurrently measure multiple different analytes. For example, currently employed CSF assays for AD measure amyloid-β, p-tau, as well as total tau, all of which give different information about AD.9
PET Biomarkers
Quantification of AD pathology using PET revolutionized the understanding of AD. By assessing AD pathologies in living humans as opposed to using post-mortem assessments, scientists were able to develop models of AD progression.10 Furthermore, the observation of elevated amyloid-β in the brains of individuals without cognitive symptoms extended post-mortem observations and helped to solidify the concept of preclinical AD.11 Amyloid-PET imaging agents bind to insoluble amyloid-β plaques, which appear many years before the onset of clinical symptoms. Often, in clinical and research settings, amyloid-PET scans are dichotomized as being “amyloid-positive” or “amyloid-negative” (Figure 2). In clinical settings, amyloid-PET scans are visually assessed by nuclear medicine physicians as “positive” or “negative” based on the presence of amyloid-PET signal in cortical regions. Amyloid-positivity is a necessary, but not sufficient condition for AD: tau positivity is also required for AD.12
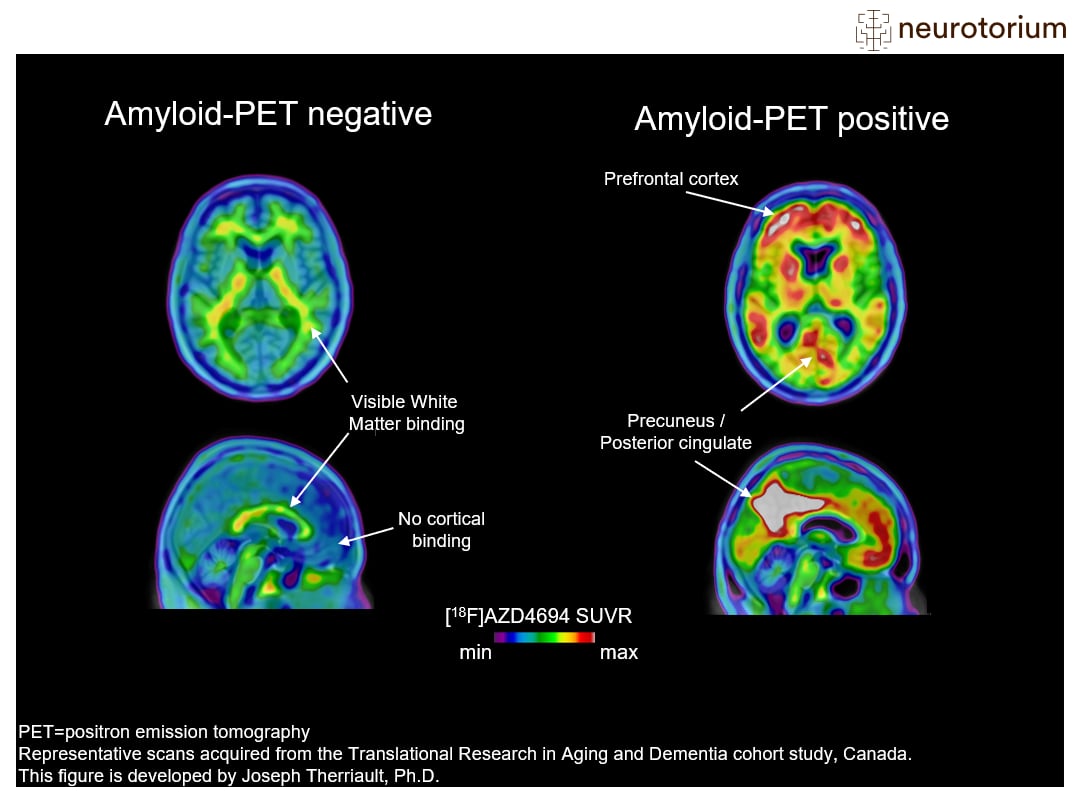
Figure 2: Amyloid-PET imaging in Alzheimer’s disease
Examples of amyloid-negative (left) and amyloid-positive (right) positron emission tomography (PET) scans. In this figure, the amyloid-PET ligand [18F]AZD4694 is shown. The hotter colours indicate more amyloid-PET tracer binding, and colder colours indicate low amyloid-PET tracer binding. The prototypical amyloid-positive PET pattern is of elevated amyloid in the brain’s posterior cingulate cortex, prefrontal cortex, as well as lateral parietal and temporal cortices. These regions display minimal tracer uptake in the amyloid-negative case (left), who has low binding across the whole cerebral cortex. Finally, it is important to note that amyloid-PET tracers have some binding to white matter, which explains the small amounts of hotter colours in the amyloid-negative case. More information on amyloid-PET visual reads can be found in Johnson KA, Minoshima S, Bohnen NI, et al. Alzheimers Dement. 2013;54(3):476-490
In vivo quantification of tau can be performed using tau-PET. Tau-PET binds to insoluble neurofibrillary tangles, another core pathological feature of AD. In contrast to amyloid-PET, tau-PET binding is closely associated with AD symptoms. In fact, the topographical distribution of tau-PET binding in the brain is related to the specific symptoms of individuals with AD: for example, individuals with tau-PET binding in the occipital lobe have more severe visuospatial symptoms, while individuals with tau-PET binding in language regions have prominent language impairment.13 Tau-PET binding increases with the severity of AD,14 and regions with tau-PET signal subsequently undergo neurodegeneration15 (Figure 3).
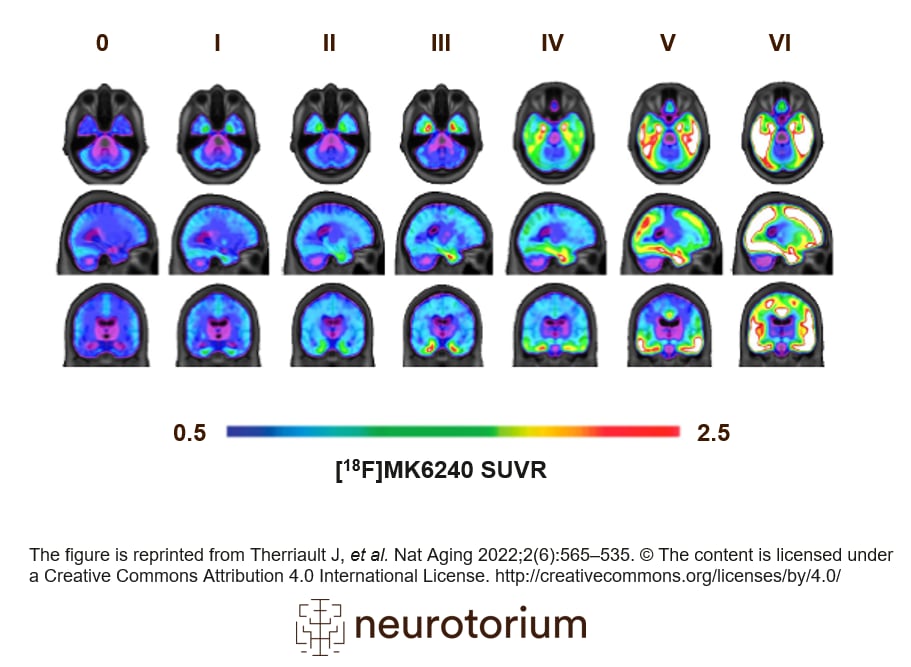
Figure 3: PET tau across stages of Alzheimer’s disease
In vivo quantification of tau can be performed using tau-PET (PET: positron emission tomography). Tau-PET binds to insoluble neurofibrillary tangles, another core pathological feature of AD. Six stages that characterize tau pathology have been established through post-mortem studies30,31 and PET brain imaging.14 This illustration represents the stages of tau pathology measured by PET. Early stages are often accompanied by mild memory dysfunction; middle stages are accompanied by mild cognitive impairment; later stages are observed in individuals with AD dementia. The figure is reprinted from Therriault J, et al. Nat Aging 2022;2(6):565–535. The content is licensed under a Creative Commons Attribution 4.0 International License. https://creativecommons.org/licenses/by/4.0/
While not specific for AD, [18F]FDG-PET is a commonly-used diagnostic tool for individuals undergoing differential diagnosis of cognitive impairment. [18F]FDG-PET measures glucose metabolism from neurons and astrocytes, and decreased cerebral [18F]FDG-PET signal is often interpreted as a sign of neurodegeneration. Because AD is typically associated with a stereotypical pattern of neurodegeneration, [18F]FDG-PET scans read by nuclear medicine physicians are often used in the differential diagnosis of AD.16 Abnormality in posterior parietal cortical areas with sparing of motor cortex is often suggestive of AD (Figure 4). An important advantage of [18F]FDG-PET is that it can also provide information about non-AD diseases: for example, there are patterns of hypometabolism associated with Frontotemporal Dementia, Lewy Body Dementia, and other neurodegenerative diseases.17
![Representative images of Fluorodeoxyglucose PET ([18F]FDG-PET) images in a control subject (left) and a patient with advanced Alzheimer’s Disease (AD) (right).](https://neurotorium.org/cdn-cgi/image/format=auto,quality=85,metadata=none/wp-content/uploads/figure-4.png)
Figure 4: PET imaging of brain metabolism in Alzheimer’s disease
Representative images of Fluorodeoxyglucose PET ([18F]FDG-PET) images in a control subject (left) and a patient with advanced Alzheimer’s Disease (AD) (right). [18F]FDG-PET measures glucose metabolism from neurons and astrocytes and decreased cerebral [18F]FDG-PET signal is often interpreted as a sign of neurodegeneration. Areas of abnormal metabolism include posterior regions such as the posterior cingulate cortex and lateral parietal cortices. Also, there is decreased metabolism in lateral temporal cortices. Note how all these regions are normal in the control subject. Furthermore, note that primary sensory areas, such as the visual cortex and sensory-motor strip, are relatively spared in patients with AD. This helps nuclear medicine physicians identify the FDG-PET pattern. More information on FDG-PET visual reads can be found in Nobili F, Arbizu J, Bouwman F, et al. Eur J Neurol. 2018;25(10):1201-1217.
While PET biomarkers have the advantage of providing information about the regional distribution of pathology in the brain, they have the limitation of only being able to evaluate one disease feature at a time. Therefore, an individual would need many different PET scans to determine their amyloid status, tau status, neurodegeneration status, and so in. In contrast, fluid biomarkers permit the evaluation of multiple different proteins from a single sample.
CSF Biomarkers
Following a lumbar puncture, CSF can be analyzed for proteins that have leaked from the brain compartment into CSF. While a vast number of biomarkers exist in CSF, this article will focus on the most widely used in AD diagnosis and in observational studies: the amyloid-β 42/40 ratio, p-tau181 and total tau. In individuals with AD, the amyloid-β 42/40 ratio is lower than it is in controls, or in individuals with other neurodegenerative diseases. This is because amyloid-β is not being cleared from the brain and is instead aggregating into plaques (detectable with PET scans). For most other biomarkers, however, patients with AD have elevated concentrations in CSF as compared to controls. Together with the amyloid-β 42/40 ratio, p-tau181 in CSF is used to identify the presence of abnormal tau phosphorylation characteristic of AD.9 Abnormality on both biomarkers is used to support the diagnosis of AD in vivo. Of critical importance, many of the biomarkers available in CSF are also present in plasma,18 albeit often in lower concentrations. With recent advances in ultrasensitive immunoassays, these proteins that characterize AD are now detectable in blood plasma
Many of the biomarkers available in CSF are also present in plasma,18 albeit often in lower concentrations. With recent advances in ultrasensitive immunoassays, these proteins that characterize AD are now detectable in blood plasma.
| Biomarker | High-performance biomarker available in CSF? | High-performance biomarker available in plasma? | Notes |
| Aβ42/40 | Yes | No (except for a single mass spectrometry assay with moderate performance) | Interpretation of plasma Aβ42/40 (as well as potential clinical implementation) is difficult due to low concentration differences in concentrations between healthy controls and individuals with Alzheimer’s disease. Correspondingly, most plasma Aβ42/40 assays have high false positive and false negative rates.27 These issues are not present for CSF Aβ42/40, which is currently used in the clinical diagnosis of Alzheimer’s disease.9 |
| P-tau181 | Yes | Yes | P-tau181 is one of the most common biomarkers for Alzheimer’s disease and has been used for many years.9,28 P-tau181 biomarkers in plasma have lower performance than in CSF.29 |
| P-tau217 | Yes | Yes | P-tau217 has recently emerged as the highest-performing biomarker for Alzheimer’s disease and is more closely associated with brain pathologies than p-tau181.29 P-tau217 assays in plasma perform equivalently to assays from CSF.20 Plasma p-tau217, pending validation in more diverse settings, will likely have a role in clinical practice. |
| Total tau | Yes | No | Total tau is a measure of neurodegeneration, a feature of many different neurodegenerative diseases. Currently, no widely used high-performing assays exist for total tau in plasma.27,28 |
Table 1: Summary of high-performing CSF and plasma biomarkers for the diagnosis of Alzheimer’s disease
Summary of high-performing CSF and plasma biomarkers for the diagnosis of Alzheimer’s disease (AD). Currently, CSF p-tau181, Aβ42/40, and total tau are used to diagnose AD in clinical practice.9P-tau217 has recently gained attention due to its high sensitivity and specificity for AD, which are both slightly higher than p-tau181. In plasma, generally speaking, the diagnostic performance of most biomarkers is lower due to difficulties in measuring very low concentrations of abnormal proteins that are present in the blood. The exception is plasma p-tau217, which has excellent diagnostic performance in plasma.20,21 In fact, plasma p-tau217 has statistically non-distinguishable performance from currently used CSF biomarkers. Therefore, plasma p-tau217 will likely have an important role in the future clinical diagnosis of Alzheimer’s disease.20,21
Plasma biomarkers
Plasma biomarkers promise to transform the diagnosis of AD due to their numerous advantages over PET and CSF.18 First, plasma biomarkers are much more accessible than PET scans, or even lumbar punctures. PET scans require tremendously specialized equipment, as well as centralized production of the radiopharmaceutical that will be injected into the patient. Lumbar punctures are relatively simpler but are perceived as being invasive by many patients. In contrast, blood-based biomarker assessments could theoretically be part of routine blood draws for patients undergoing evaluation of cognitive impairment. Plasma biomarkers are also much cheaper than PET scans: the cost of a typical amyloid-PET or tau-PET scan is estimated to be approximately 3000$ as of 2023, while a plasma biomarker assessment could be less than 300$ (however, how these biomarkers will be priced and reimbursed is still an open question).
While greater scalability and accessibility of plasma biomarkers are important advantages over CSF and PET, ultimately their diagnostic performance must be non-inferior to currently available diagnostic methods to be useful.19 While there are a number of eligible plasma biomarkers (most of which are also measurable in CSF), one biomarker in plasma is understood to be the candidate biomarker for clinical implementation studies. The most promising plasma biomarker for the identification of AD in vivo is plasma p-tau217 (tau phosphorylated at threonine 217). P-tau217 is similar to p-tau181 (described in the CSF paragraph above), however, accumulating evidence suggests that phosphorylation at threonine217 is more specific to AD than phosphorylation at threonine181. Plasma p-tau217 has the largest effect size for differentiating between individuals with AD and controls, and rises in relation to brain concentrations of amyloid-β and tau pathologies.18 Furthermore, recent studies have suggested that plasma p-tau217 performs equivalent to established assays from CSF,20,21 suggesting that the increased accessibility and scalability of plasma p-tau217 is not offset by lower diagnostic accuracy. P-tau217 also displays excellent (approximately 95%) diagnostic accuracy to differentiate individuals with AD neuropathology from individuals with non-AD neurodegenerative diseases.22
Current and future clinical uses of AD biomarkers
Appropriate use recommendations for anti-amyloid therapies (aducanumab, lecanemab, likely soon donanemab) require the determination of amyloid positivity before initiating treatment.23,24 Because these therapies target and remove amyloid-β from the brain, they are not anticipated to be of any benefit to individuals without amyloid-β pathology. The appropriate use recommendations require amyloid-β status to be determined using either PET or CSF, which presently have strong evidence of their suitability to identify amyloid-β.
It is anticipated that at some point in the future, plasma biomarkers will be used in the identification of AD in living people. One potential strategy for plasma biomarkers is using them as screening or even “pre-screening” tools. In such a framework, an individual would have a plasma biomarker performed after their clinical assessment. If a person is positive for the plasma biomarker, that individual may be eligible for PET scanning or for a lumbar puncture to confirm the presence of amyloid-β, or other AD pathologies. Alternatively, plasma biomarkers may be used as “rule in” tests, with individuals with a negative plasma biomarker result eligible for PET or CSF assessments to confidently rule out AD from the differential diagnosis. A correct understanding of the pre-test probability of harbouring AD brain pathologies with respect to age, sex, APOE genotype and clinical features will be critical to correctly interpreting plasma biomarkers for AD.25
It is anticipated that at some point in the future, plasma biomarkers will be used in the identification of AD in living people. One potential strategy for plasma biomarkers is using them as screening or even “pre-screening” tools. In such a framework, an individual would have a plasma biomarker performed after their clinical assessment.
Despite their promise, how plasma biomarkers are used as screening or diagnostic tools remains to be determined. For the time being, their use in asymptomatic individuals is not recommended, largely because currently anti-amyloid therapies are only available for individuals with cognitive symptoms.23,24 Correspondingly, their use as widespread screening tools, or as commercially available direct-to-patient kits, is not recommended.18
Conclusions
PET and CSF biomarkers are currently used in specialized centre for the differential diagnosis of AD under specific circumstances.9,26 These biomarkers are useful because of the limited correspondence between classical AD symptoms and the pathologies that defined AD: amyloid-β plaques and tau tangles. As anti-amyloid therapies gradually begin to become used, there will be a higher need for the identification of amyloid-β pathology in individuals with cognitive impairment to determine eligibility for therapy.23,24 Plasma biomarkers promise to be helpful in this regard, but more work is needed to understand their interpretation at the individual-level.
Related content
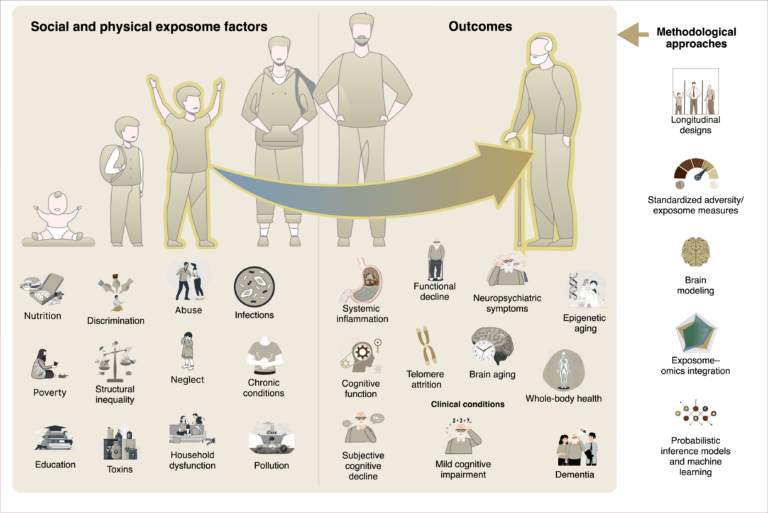
Social and physical exposome factors—like poverty, pollution, and inequality—accumulate over time, shaping biological aging and cognitive decline. Through inflammation and cellular stress, these exposures drive neurodegeneration, highlighting the need for longitudinal, integrative research.

The exposome reframes dementia as the product of cumulative physical and social exposures-like pollution, nutrition, and inequality-across life. These factors shape brain aging through inflammation and epigenetic change. Lifespan, global studies are key to equitable dementia prevention.