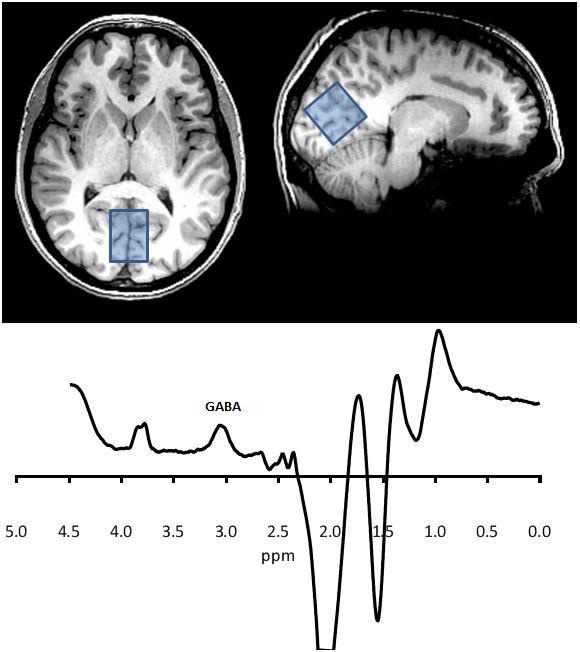
An MRS recording – peaks give a measure of the concentration of different substances
This fig shows a spectrum analysed in such a way as to enhance the signal from the specific resonances in the GABA molecule. The area under the GABA peak represents its concentration in the large occipital voxel shown. Other peaks can be defined that represent other molecules such as glutamate, creatinine, choline and N-acetylaspartate.
Source. David Nutt, Imperial College London.
Related content

Stroke, migraine, Alzheimer’s Disease and other dementias were among the top ten conditions that accounted for the greatest nervous system DALYs in 2021

An illustration of the progression of addictive disorders over time.

Alzheimer’s disease (AD) is the most prevalent neurodegenerative disease and the leading cause of dementia worldwide, regardless of socioeconomic status.