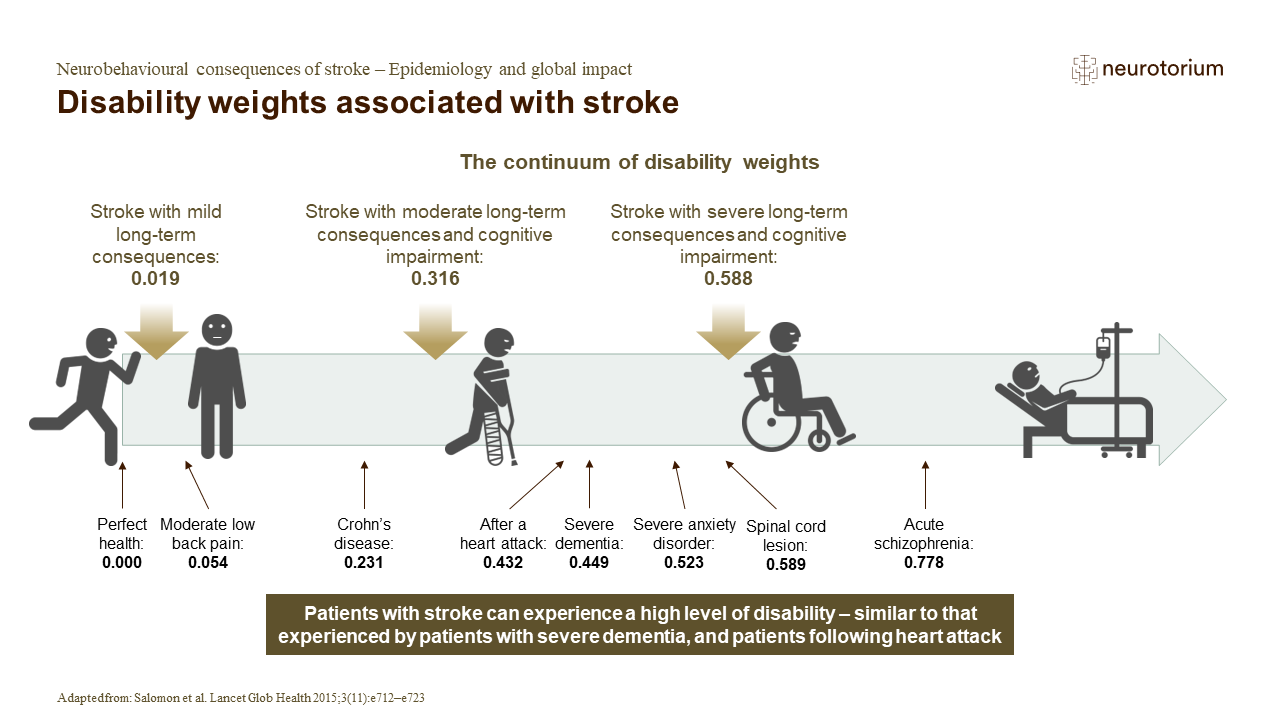
Health utility scores, examples of which are shown on the slide, can be generated using many different methods, including:2
- The standard gamble: individuals are presented with a choice between a certain health state (e.g., the current state), or a gamble with one better (e.g., perfect health) and one worse (e.g., death). The odds are adjusted until the individual takes the gamble, e.g., a 10% chance of dying against a 90% chance of being cured back to perfect health.
- Time trade-off methods: individuals are asked how many years of perfect health they would trade for their life expectancy in their current health state – what proportion of their life they would sacrifice to be cured of a certain condition.
- A visual-analogue rating scale: individuals are asked to mark along a scale where a certain health state lies, e.g., between 100 for ‘the best health imaginable’, and 0 for ‘the worst health you can imagine’.
2. Phillips. Health Economics: An Introduction for Health Professionals. Blackwell, 2005.