


Images
Filter
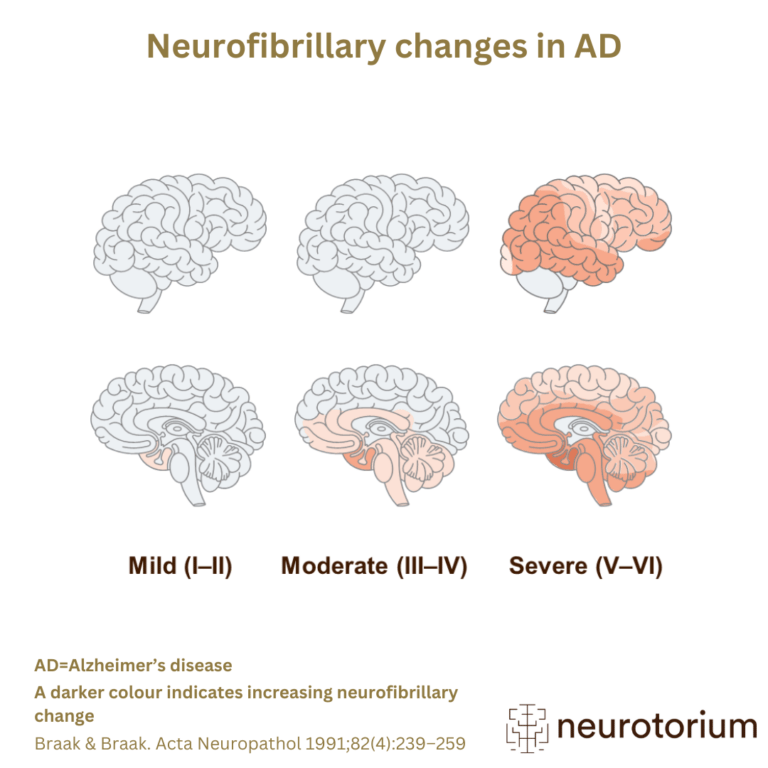
The staging method developed by Braak and Braak suggests that the neurofibrillary pathology of AD progresses in a relatively predictable sequence.
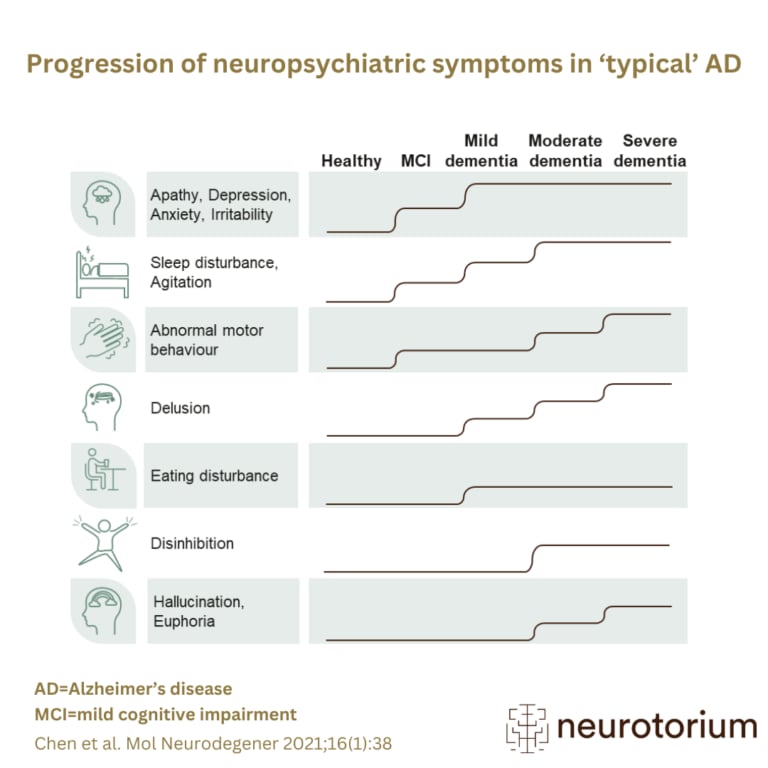
The symptoms of AD can be generally divided into three categories – cognitive, functional, and neuropsychiatric.
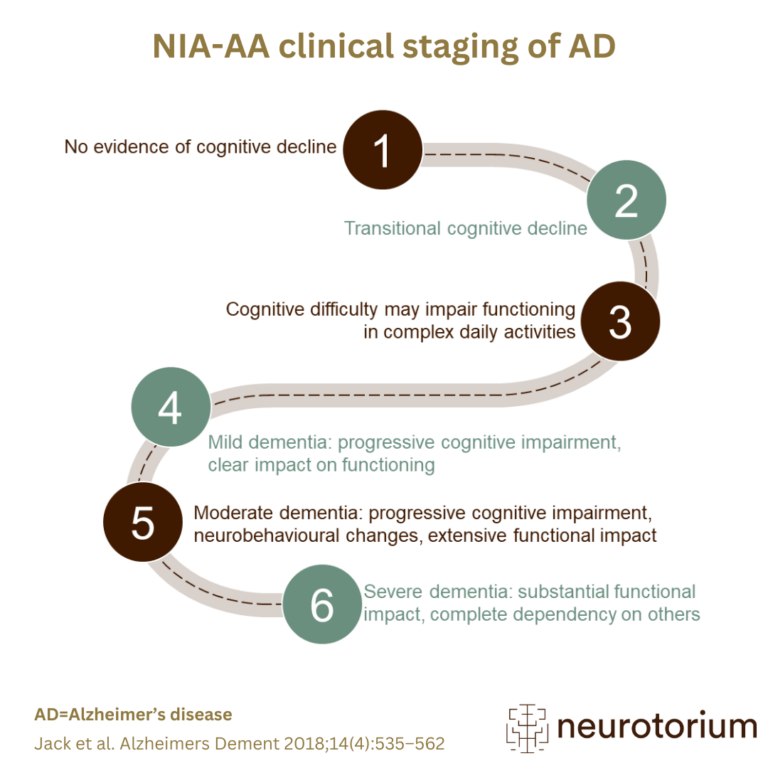
A variation to the clinical staging of AD was proposed by the National Institute on Aging – Alzheimer’s Association (NIA-AA) working group (2018) using six clinical stages for persons who are amyloid positive.
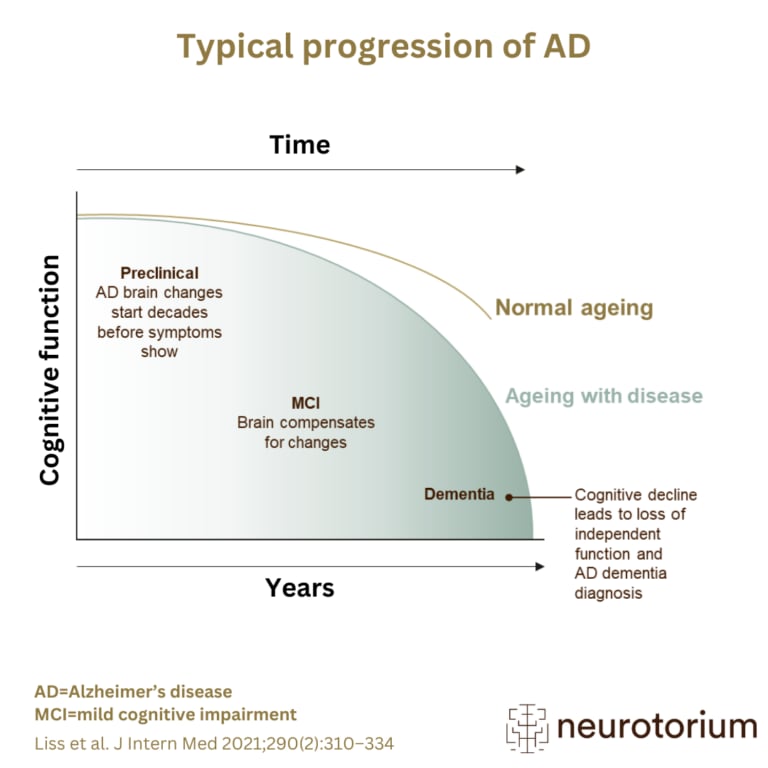
Alzheimer’s disease can be characterized by three main phases – preclinical AD, MCI (Mild Cognitive Impairment) and dementia.
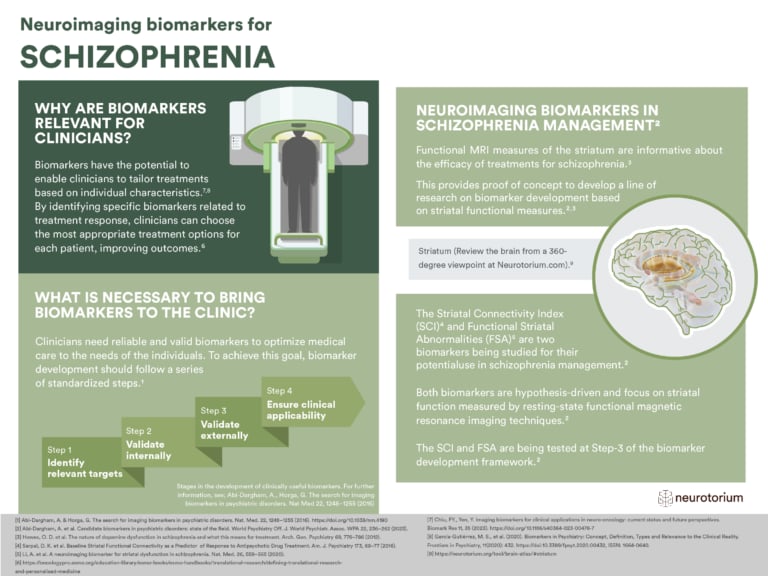
This infographic provides a visual, at-a-glance overview of why biomarkers in schizophrenia are relevant for clinicians, what is necessary to bring biomarkers to the clinic and neuroimaging biomarkers in schizophrenia management.
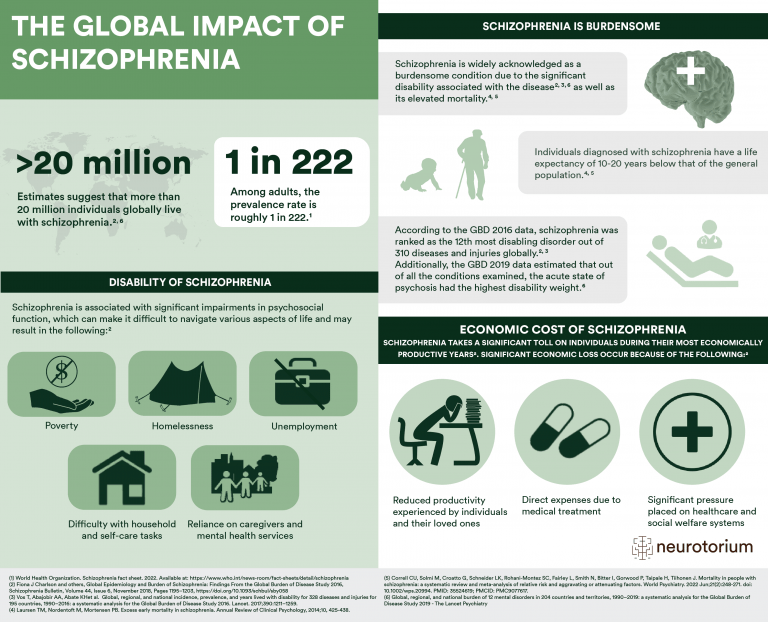
20 million+ individuals globally live with schizophrenia. Schizophrenia is associated with significant impairments in psychosocial function. This infographic provides a visual, at-a-glance overview of the epidemiology, economic cost and the global impact of schizophrenia.
No results matched your search.
Please try again.